dadreamer
-
Posts
369 -
Joined
-
Last visited
-
Days Won
43
Content Type
Profiles
Forums
Downloads
Gallery
Everything posted by dadreamer
-
 I'm still investigating things, but now I start to think that it's kinda complicated task. I've found no easy-to-use function in LabVIEW internals to get that pointer. And there's another difficulty - the refnum should be matched with the object, it relates to. I see no any refnum info in Heap Peek's object (and its DCO) properties. There's UID in the very first string, so that potentially could be used to identify the object needed. In that case the list of all VI objects should be retrieved (from OH or DS Heap, I guess) and each object should be analyzed to know, if its UID matches our one. Somewhat straightforward approach, but it's the best I could come up with. Maybe someone knows a better solution... As to refnums, there's MCGetCookieInfo and its wrapper named BaseCookieJar::GetCookieInfo, but I don't know a reliable way to find out a Cookie Jar for concrete LabVIEW instance. And even having that I'm unsure whether that function returns the necessary data.
 -
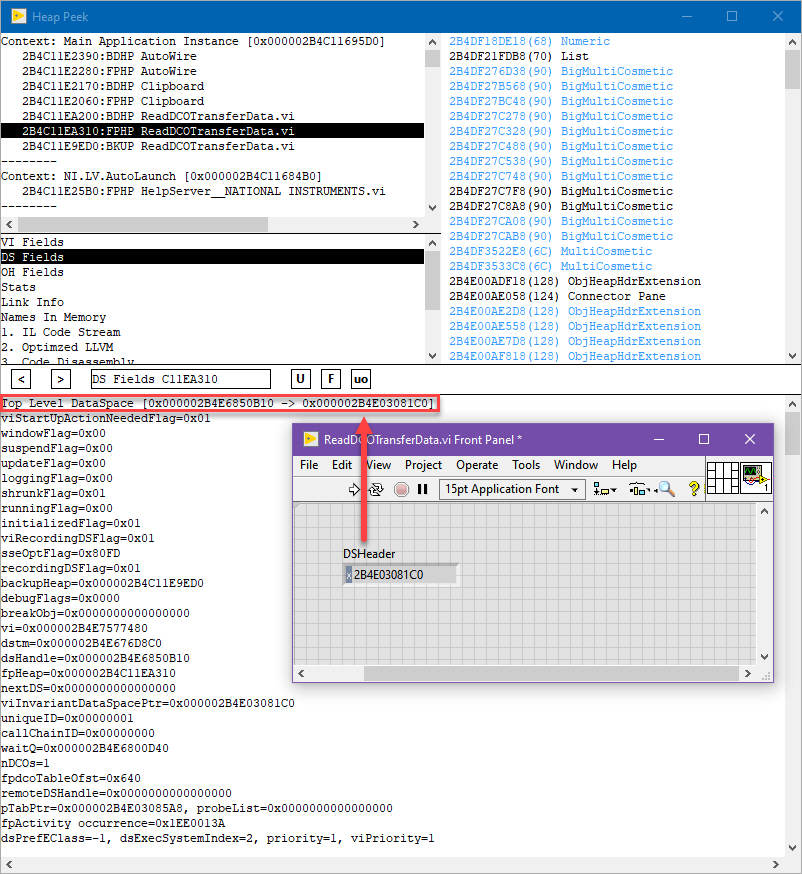
This gives you a pointer to VI Data Space, not to the object's own space. Well, I see what you want to obtain, so I recheck later, whether it's possible to retrieve a pointer to the object itself.

-
Do you need VI Data Space pointer? If yes, then you could use GetDSFromVIRef internal function - check my samples with ReadDCOTransferData / WriteDCOTransferData calls. That function is available in LabVIEW starting from 2009 version.
-
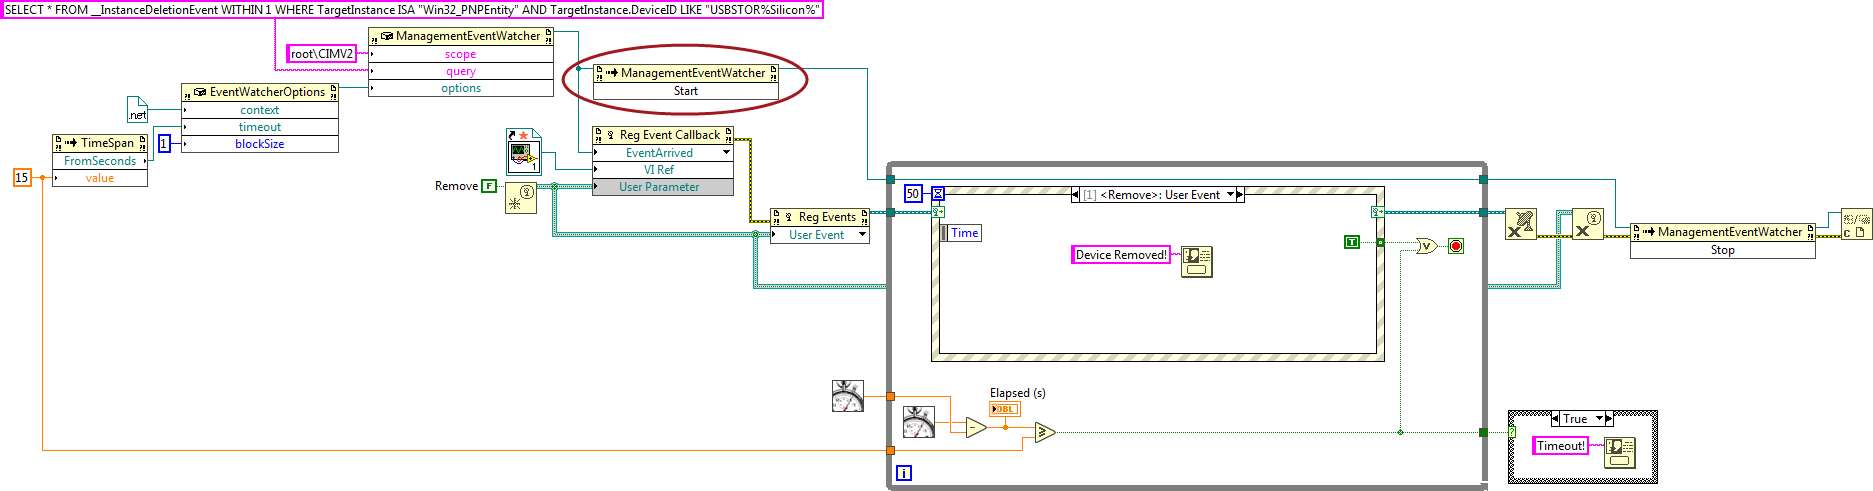
Should ManagementEventWatcher.Start method be called in order for it to run asynchronously? Something like this: WMI_USBStorage_Event_withDeviceIDandTimeOut.viCB.vi Tested this sample on my own USB drive and it works fine.
-
Selecting multiple folder paths at the same time?
dadreamer replied to caleyjag's topic in User Interface
Could you elaborate on the problem you are facing? If you received Error 1386: The Specified .NET Class is Not Available in LabVIEW, then you most likely should unblock the DLL downloaded first and only after that you launch LabVIEW and run that example. See this article for the details. -
Selecting multiple folder paths at the same time?
dadreamer replied to caleyjag's topic in User Interface
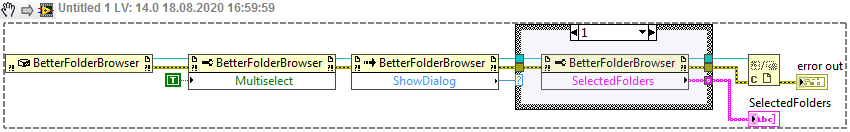
I'm kind of unsure whether this could be accomplished with a common File Dialog or an underlying yellow File Dialog and its ExtFileDialog internal function. But you could switch to .NET and use some third party libraries available. One of those is BetterFolderBrowser proposed here. I have just tested it on both 32- and 64-bit LabVIEW 2019/2020 and it works great. Here's the basic example: Untitled 1.vi
-
Did you have a look at VI Scripting? If not, check the following example - [LabVIEW]\examples\Application Control\VI Scripting\Creating Objects\Adding Objects.vi To be able to create controls or indicators you should open the BD and change VI server class for "Function" constant to Generic -> GObject -> GObject. Then you change "Subtract" constant to something like "Numeric Control" and run the VI. Hope, this will help you move further with your task.
-
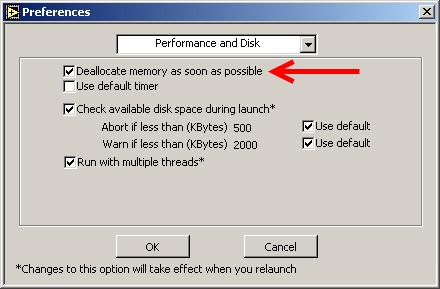
Well, they're obviously not enough to have an absolute control over SH, including memory pools management as per SH API. Unfortunately I don't see any other functions or private nodes exposed, except maybe FreeSmartHeapPool function of mgcore, but that one crashes LV for some reason. I'm afraid, my find about mgcore's switching is almost useless, because compiled app (i.e. EXE) uses lvrt.dll, which already has mgcore stuff integrated into it, so no way to disable SH in lvrt, as it would require its recompile from the sources. And I never saw any different versions of LVRT except a classic one and a Full Featured one. Honestly, I don't know, why LabVIEW is shipped with 4 variants of mgcore, even if it's using only one of them. Yeah, it doesn't help much, because it's like you have inserted RD block in the end of every VI. In LabVIEW before 7.x there was "Deallocate memory as soon as possible" checkbox in the settings. This setting was stored in INI as anxiousMemoryDeallocation token. In 7.x they removed the checkbox and likely renamed anxiousMemoryDeallocation token to overanxiousMemoryDeallocation. LabVIEW still tries to read overanxiousMemoryDeallocation on the start, thus it could be used if needed. Not much sense for that though. By the way, this wiki page should be updated as well.
-
Quick Drop plugin - retain data across calls
dadreamer replied to Marshall Eubanks's topic in VI Scripting
By chance I came across those private nodes too and played with them a little. They allow to retain the data per LabVIEW process. That means, you may get access to data in any VI in any project. Feels like Tags, that are not stored inside VI DS. Neat feature, indeed. -
Thanks, Rob! Very well done research with a lot of technical details, as we all here like. 🙂 After reading and re-reading your post and SH related documents and playing with the samples I still have one question. Can we control SH behaviour in any ways or is it up to LabVIEW Memory Manager completely? Say, could I make SH to empty its pools and free all the data cached, thus reclaiming the space occupied? Or it never gives it back to me entirely? Could I disable SH utilization somehow or is it hardcoded to be always on? I found few private properties to control Memory Manager settings, e.g. Application.Selective Deallocation, Application.Selective Deallocation.EnableForAllVIs, Application.Selective Deallocation.LargeBufferThreshold and Application.NeverShrinkBuffers, but playing around these doesn't help much. I would say, it even worsens the situation in some cases. Currently I see no way to return the occupied memory, thereby LabVIEW can (and will) eat as much memory as it needs for its purposes. So, we have to live with it, don't we?.. upd: I think I found something. In [LabVIEW]\resource folder there are four variants of Memory Manager library: mgcore_20_0.dll - no SH, no AT (Allocation Tracker) mgcore_AT_20_0.dll - with AT mgcore_AT_SH_20_0.dll - with both SH and AT mgcore_SH_20_0.dll - with SH LabVIEW uses SH version by default. If we switch to "no SH, no AT" version by backupping mgcore_SH_20_0.dll and renaming mgcore_20_0.dll to mgcore_SH_20_0.dll, then the memory consumption is somewhat reduced and we get more memory back after RD was called. On default mgcore_SH_20_0.dll I'm getting these values: LabVIEW is opened and the example is running - 199 056 KB; After the string array was once created (RD is on) - 779 256 KB (the peak value is at ~800 000 KB); After the VI is stopped and closed - 491 096 KB. On mgcore_20_0.dll I'm getting these values: LabVIEW is opened and the example is running - 181 980 KB; After the string array was once created (RD is on) - 329 764 KB (the peak value is at ~600 000 KB); After the VI is stopped and closed - 380 200 KB. Of course, it all needs more extensive testing. I see however, that "no SH, no AT" version uses less memory for the operations and so it could be prefferable, when the system is fairly RAM limited.
-
All the DLLs may be added into the project manually (by RMB click -> Add -> File) and in the build spec's on the Source Files tab the DLLs should be put into Always Included category. When the build finishes, you will have the DLLs in the 'data' folder. Just tested with a trivial project and it worked fine.
-
From my own experience with CLFNs, if you set "Specify path on diagram" checkbox in the CLFN's settings, LabVIEW always uses the path from the diagram and never uses the path from "Library name or path" field. When you set that checkbox everywhere, all you need is to construct proper path for both 32 and 64 bits and pass it into your CLFN(s). Here's the article, which may help: How to Configure LabVIEW to Use Relative Paths for DLLs? Another option for you might be using of an asterisk in the library name to distinguish between 32 and 64 bits. Refer to Configuring the Call Library Function Node article and look for how to use the * wildcard.
-
Yeah! LabVIEW 2020 64-bit - RD doesn't work for strings as it should do. Even when the VI is unloaded, LabVIEW still holds some memory allocated and never releases. No tracks of it on NI forums. Anyone with internal access to the list?
-
AFAIK i386 is for Windows 32-bit and wx64 is for Windows 64-bit. Following this logic u should be for Linux and m for macOS, but I'm not 100% sure. I'm just saying, what I saw when browsing through a number of CINs with their PLAT sections.
-
You might try loading macOS LV version into debugger, because it has more debug symbols unstripped unlike Windows and Linux versions. As I recall I was able to read out the rest of the parameters and their types just by browsing the code in IDA. It's mostly about old LV versions before LV 2009. Check LVSB and PLAT resource sections (and maybe LIsb for external subroutines), if you're going to study how CINs work. There are Rolf's articles also, that could help you to put all the pieces together: https://forums.ni.com/t5/LabVIEW/What-happened-to-CINs-And-how-else-can-another-language-work/m-p/2726539#M807177
-
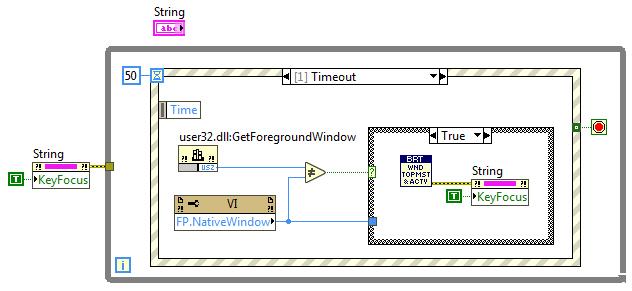
Try to use this VI to get your window on top of the world: Set Calling VI Wnd Topmost & Active.vi This is the thread, where it came from. You may use it this way: wnd_test.vi Or you may invoke the SubVI at strictly specified intervals, you decide.
-
Okay then. Your software - your rules. 🙂 I'm just worried about some cases with it, so I'm going to ask. As I'm mostly work on modern LabVIEWs (2018, 2019, 2020) and your tools weren't tested on anything higher than LV 2014... What is the worst thing that can happen, when I try to unpack/pack such VIs? Could those be not fully unpacked or packed? Or something got corrupted? Is it safe to ignore the frequent warnings on VI (un)packing? There are always few of them, e.g. Block b'VICD' section 0 XML export exception: The block is only partially exported as XML. , Block b'VICD' section 0 binary prepare exception: Re-creating binary is not implemented. , Block b'VICD' section 0 left in original raw form, without re-building. Sometimes I saw the message "No matching salt found by Interface scan; doing brute-force scan", when packing back VI w/ some sections slightly modified. It then leaves me waiting to get the process finished (honestly, my biggest record is 10 minutes 😄, I always interrupted it). How/what could I do to escape that? Is there some option to force the recalculation, like in flarn's utility (fixing checksums)? It works fine even on the recent LabVIEW 2020. Do you mean rewriting pylabview for my needs? Even if I, say, want to rename some section? I imagined that as few additional parameters, e.g. "section" and "new section", and that's all to do the job. And no need to repack everything. Ok, how could I easily rename some section, having all the VI's files already extracted? I don't worry about the times at all now, as it's not for my work tasks. I experiment with that mostly for my own purposes. I'm aware of tools like that and use some. Thx for the advice anyway. This is not a question of finding some proper addresses in memory for me, it's all about universality. 😉 In the past I already made some plug-in, that was relying on the internal memory offsets. It was a total pain in the ass to find and code correct offsets for each and every LV version. And that was even much more pain with each new LV version, because there were absolutely new offsets. So it was requiring a large amount of time to provide versatility. Finally I gave that up years ago. Since then I hate hard-coding variables based on unreliable internal knowledge, such as memory locations etc. That may change and changes rapidly and all the code goes to trash. I prefer not to write such programs at all.
-
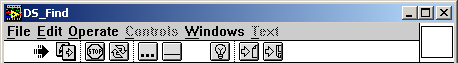
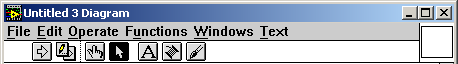
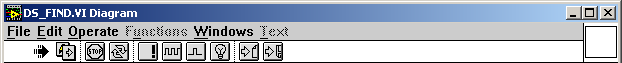
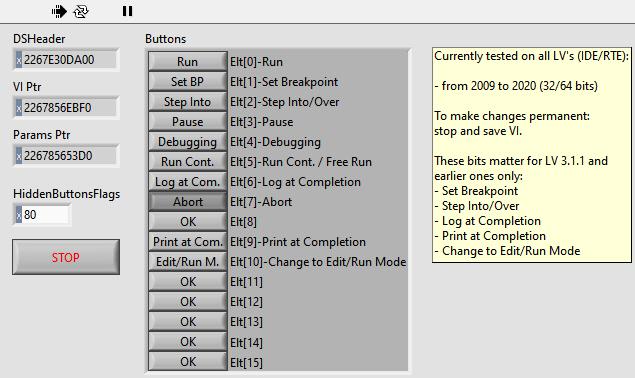
Thanks, I will take a look, when will have fun studying any VI internals again. Could I request one more feature, if possible? It would be very nice to have a support for in-place sections modification (e.g., type, id or binary contents), without unpacking into .xml and packing back (like in flarn's utility). I assume, the checksums should be recalculated, if dependent sections are altered, as it's already done for the password option. That would save time on simple binary operations. Meanwhile I was going to make a VI to show/hide those toolbar buttons, just for fun. Reality shows that the offsets in VI's memory are varying vastly between different LV versions, bitness and IDE/RTE mode. So likely I won't be posting that. I just put this little picture, so you could name ViBhBit3 and ViBhBit4 bits in ButtonsHidden field. I suppose the rest of the bits is for reserved purpose and does nothing, but I'll recheck on older LV versions and update this posting. Now closer to your code: class VI_BTN_HIDE_FLAGS(enum.Enum): """ VI Tool Bar Buttons Hidding flags """ RunButton = 1 << 0 # Indicates whether to display the Run button on the toolbar while the VI runs and when it's in edit mode as well. In LV14: Customize Window Apearence -> Show Run button. When off also hides Run Continuously button. SetBPButton = 1 << 1 # Set Breakpoint button (LV 3.x and earlier). StepIOButton = 1 << 2 # Step Into/Over button (LV 3.x and earlier). When on the button is shown, but disabled (inactive). PauseButton = 1 << 3 # Indicates whether to display the Pause button on the toolbar while the VI runs and when it's in edit mode as well. Not implemented in LV as a separate GUI setting. DebuggingButton = 1 << 4 # Indicates whether to display the Highlight Execution, Start Single Stepping (Step Into, Step Over) and Step Out buttons on the toolbar while the VI runs and when it's in edit mode as well. Not implemented in LV as a separate GUI setting. FreeRunButton = 1 << 5 # Indicates whether to display the Run Continuously button on the toolbar while the VI runs and when it's in edit mode as well. In LV14: Customize Window Apearence -> Show Run Continuously button. The button isn't shown, if Run button is hidden. LogAtCompButton = 1 << 6 # Log at Completion button (LV 3.x and earlier). AbortButton = 1 << 7 # Indicates whether to display the Abort Execution button on the toolbar while the VI runs and when it's in edit mode as well. In LV14: Customize Window Apearence -> Show Abort button. ViBhBit8 = 1 << 8 # unknown PrintAtCompButton = 1 << 9 # Print at Completion button (LV 3.x and earlier). EditRunModeButton = 1 << 10 # Change to Edit/Run Mode button (LV 3.x and earlier). ViBhBit11 = 1 << 11 # unknown ViBhBit12 = 1 << 12 # unknown ViBhBit13 = 1 << 13 # unknown ViBhBit14 = 1 << 14 # unknown ViBhBit15 = 1 << 15 # unknown --- Here's my "dirty"/hacky tool to show and hide all the toolbar buttons: But_Show_Hide.vi Tested that on LV 2009 to 2020 (both 32- and 64-bits). Maybe it will work on anything newer than LV 2020 in the future, nobody knows yet. It won't work on versions older than LV 2009, because the difference between LV 2009 and LV 8.x is way too large. And I will not be maintaining this tool at all, as it's (almost) useless for anyone including me. Use it as is or forget it. Small update: In LV 3.1.1 and earlier ones there was no separate Tools palette, all the tool buttons were on the toolbar. Here's how it looked for stopped VIs: This was for running VIs: Button 2 ("Pencil with Run arrow") was for switching between Edit and Run modes, button 5 ("...") was to set a breakpoint on the VI, button 6 ("___") was to pause the running VI, buttons 8 and 9 ("Run arrow with file/floppy") were to enable logging or printing respectively at the VI completion. Sure you know the rest. When pressed button 5 was turning into "!" button (breakpoint was set). When pressed button 6 was turning into "Square wave" button (to unpause the VI) and was showing "Single square step" button (to step into/over the VI nodes). Here's how those buttons looked pressed: I've updated the corresponding bits in my tool to reflect those early buttons too, even though the tool won't work on anything lower than LV 2009. The source of pylabview might be updated accordingly.
-
I'm unable to invoke Heap Peek with the keys combination on VM with Ubuntu. I would check on a common installation, but don't have one ATM. But adding various tokens to the config file (/home/<username>/natinst/.config/LabVIEW-x/labview.conf) works fine for me.
-
Here's the version back-saved for LV 2011: HeapPeek_WinMonitor.vi Heap Peek and Window Monitor are both available on Linux and macOS. And if one wishes to recreate these brown nodes manually, then (s)he should put SuperSecretPrivateSpecialStuff=True into LabVIEW.ini and restart LabVIEW; when done, a number of hidden private nodes appears.
-
Okay, now that is simplified. To extract VIs out of .lvlibp (no matter, if FFF-enabled or not): Open extract_lvlibp_vis.vi (attached -> extract_lvlibp_vis.vi ), set path to your PPL (.lvlibp) and the destination folder and run the VI. The files should be extracted and placed to the chosen folder. Extract the inner resource blocks from a single VI with readRSRC.py -x -i "YourVI.vi" command. YourVI.xml and a bunch of various resource sections should appear. Open YourVI.xml and change the library name extension from .lvlibp to .lvlib (between <LIBN></LIBN> tags). Remember the .lvlib name. Save and close the .xml. Pack the .xml and all the resources into a single VI with readRSRC.py -c -m "YourVI.xml" command. You should get YourVI.vi recreated. Do not open it yet. In LabVIEW create new empty library and save it into the same folder, where YourVI.vi resides. Use that name, you obtained on the step 3. Now drag YourVI.vi from the folder into the library's root. LabVIEW should reload the VI from the new path and report. * Untie YourVI.vi from the library w/ RMB -> Remove from Library menu option, save both files w/ File -> Save option. Now you may close YourVI.vi and open again to make sure, it's not broken. Optionally repeat the steps 2-7 for any other VIs from that .lvlib. To extract VIs out of .exe (for non-FFF EXE's you finish on the 4th step): Open YourApp.ini and add two lines to its end according to this article. Launch YourApp.exe and leave it in this state. Open extract_exe_vis.vi (attached -> extract_exe_vis.vi ), set path to the destination folder and run the VI. The files should be extracted and placed to the chosen folder. Make sure, you're using the same port number, that you've set on the step 1. If 3364 doesn't work for some reason, try another number (3363 etc.). For EXE's without FFF option: Now you may open your VIs and make sure, they are fine. For EXE's with FFF: go to step 5. Load a single VI into flarn's Resource Editor. ("Load" button). Find CLIv resource section and change its Type to LIvi. Find CLId resource section and change its Type to LIds. Save the VI with "Save" button. Don't do any other actions here like fixing checksums or whatever. Now you may open YourVI.vi to make sure, it's not broken. Optionally repeat the steps 5-8 for any other VIs from that .exe. * N.B.: In projects with more or less complex hierarchies it might be a good idea not to untie your VIs from the library, because it's very easy to mess with the correct order of such an unlinking. When done incorrectly, your VIs could become broken and to fix them you have to recreate the original VI(s) from the .lvlibp. Also to note, such an untying doesn't work neatly for VIs of different levels of dependence, i.e., a VI has some SubVI(s) and they all are contained into that .lvlibp; on unlinking them you'll likely get those SubVI(s) fine and the main VI broken. But if you really want to detach each and every VI from the library, you first make sure, that your VI is working fine inside that library, then unpack the VI with readRSRC.py, in .xml remove lines like <String>Untitled Library 1.lvlib</String> in LIvi and LIds sections, then pack again to VI, move dependent SubVI(s) out of the library and open up the main VI. It may work or may not, you test it out by yourself.
-
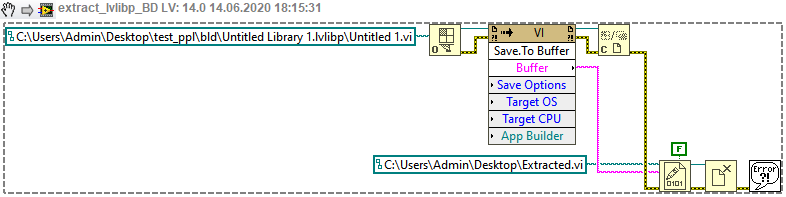
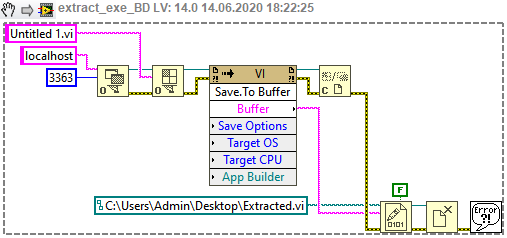
So far I have left those instructions as they are, because I don't know atm, how to eliminate some steps. I believe, there should be a LabVIEW-native way to unlink the VI from the library, thus we could exclude steps 11-14. It would be easier then to automate this algorithm to process multiple VIs. Unfortunately Disconnect From Library method doesn't work on locked libraries and Open VI Reference or even Open.VI Without Refees don't work on broken VIs. There are Linker.Read Info From File and Linker.Write Info To File private nodes also, but I still have not figure out, whether they could be used for the task (any ideas?). That's why I decided to switch to LEIF formatted lib's and exe's. I found that we can bypass LEIF loader RE-ing using Save.To Buffer private node (always felt uncomfortable studying that loader, because it's rather complex). The node returns convenient RSRC with LVINLBVW block instead of LEIF, so we can easily save that into the file to deal later. I suppose, LEIF data is always translated into common resources by LabVIEW and they're in memory until the VI's are unloaded. Here's how a single VI may be extracted out of .lvlibp: extract_lvlibp_vi.vi And here's how the same may be done with the EXE: extract_exe_vi.vi To open VI inside EXE I used technique, described in this article: Passing Data Between LabVIEW Executable Reference VI and a VI Upd: see next message for the instructions. I appreciate if you find time to take a look at LEIF binaries some day, as I think you're more experienced in VI contents and internals than me. 🙂 By the way I tried readRSRC.py with LabVIEW 2020 built executable without FFF option and it worked like a charm. I can't do the same with PPL's, because that Fast File Format is forced onto them hardly and I've found no way to switch it off.
-
NXG, I am trying to love you but you are making it so difficult
dadreamer replied to Neil Pate's topic in LabVIEW General
There was even a (very) short thread on LAVA: By the way I always wanted to try, but I was a bit late to it, so never seen any files to download and play around freely. Does anyone still have it on their hands? Or does it require a special licensing and thereby unavailable? -
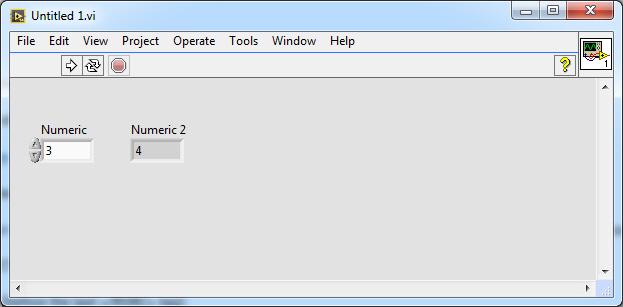
I have updated this message, as after trial-and-error takes I've got success finally! As you can see, the VI is in runnable state and behaves without any errors. My steps to reproduce: 1. Unpacked lvlibp with 7-Zip unarchiver (as I'm on Windows currently) and pulled out "2" file (LIBPLBVW resource). 2. Extracted the inner resource blocks with readRSRC.py -x -i "2" command, got 2.xml, 2_DATA0.bin to 2_DATA4.bin and 2_LVzp.bin files. 3. Unpacked 2_LVzp.bin with an unarchiver, got NI_Embedded_Library.xml and Untitled 1.vi files. 4. Extracted the inner resource blocks from Untitled 1.vi with readRSRC.py -x -i "Untitled 1.vi" command, got Untitled 1.xml and a bunch of various resource sections. 5. Renamed 2_DATA0.bin (from step 2) as Untitled 1_VCTP.bin and placed it near Untitled 1.xml. 6. Added the following text to the end of Untitled 1.xml (before the last </RSRC> tag): <VCTP> <!-- VI Consolidated Types --> <Section Index="0" Format="bin" File="Untitled 1_VCTP.bin" /> </VCTP> 7. Packed the .xml and all the resources into a single VI with readRSRC.py -c -m "Untitled 1.xml" command, got Untitled 1.vi. 8. Extracted the inner resource blocks from Untitled 1.vi (again!) with readRSRC.py -x -i "Untitled 1.vi" command, got Untitled 1.xml and a bunch of various resource sections (is done to get VCTP processed correctly). 9. Opened Untitled 1.xml and removed everything from <LIBN> to </LIBN> (including the tags as well) changed the library name extension from .lvlibp to .lvlib (between <LIBN></LIBN> tags). To wit, this line <Library>Untitled Library 1.lvlibp</Library> should be turned into this <Library>Untitled Library 1.lvlib</Library> 10. Packed the .xml and all the resources into a single VI with readRSRC.py -c -m "Untitled 1.xml" command, got Untitled 1.vi. 11. Renamed NI_Embedded_Library.xml (from step 3) to Untitled Library 1.lvlib. 12. Opened Untitled Library 1.lvlib in a text editor and altered the lib URL to point to the new location. To wit, this line <Item Name="Untitled 1.vi" Type="VI" URL="Untitled 1.vi"/> should be turned into this <Item Name="Untitled 1.vi" Type="VI" URL="../Untitled 1.vi"/> 13. Opened the VI (LabVIEW did the library reload from the new path and reported), opened .lvlib. 14. In Project Explorer untied the VI from the library w/ RMB -> Remove from Library menu option, saved the both files w/ File -> Save option. Now the VI runs fine, so it might be a time to simplify this tutorial a little 🙃 If your tools could support lack of VCTP and recreate it automagically, that would be great for sure.
-
I've got nearly the same result, using flarn's Resource Editor, so fixing LVSR and BDPW blocks is pretty easy. Untying from the library is no problem too. Tomorrow I'm gonna try your tools to see, how they'll go for me, and try to restore VCTP as well according to your info (manually maybe, but hope it could be automated one day). On success I could take a look at LEIF packed libraries to figure out, how to do the same. I was kind of surprised here, because both EXEs and PPLs don't have block diagrams, unless you explicitly set 'debugging' option in the build properties to get the BDs saved. Thus that 'tampered' message is absolutely unnecessary in compiled app or library, but likely there's no additional check in lvrt.dll for such a case, when the checksums don't match.