dadreamer
-
Posts
369 -
Joined
-
Last visited
-
Days Won
43
Content Type
Profiles
Forums
Downloads
Gallery
Everything posted by dadreamer
-

Selecting multiple folder paths at the same time?
dadreamer replied to caleyjag's topic in User Interface
Here 😉 -
Image-aquisition with LabView2020 for Linux from a GigE Camera
dadreamer replied to Yaw Mensah's topic in LabVIEW General
I have used PostLVUserEvent Manager function for a few times in my own callback libraries to send the video/image data from the framegrabber into LabVIEW. It was always working fine for me. I'm sure, back in the days I have used this code sample as the base for interaction with a callback DLL. On Linux you may use dlopen (instead of LoadLibrary) and dlsym (instead of GetProcAddress) from \usr\lib\x86_64-linux-gnu\libdl.so to pass your callback into the vendor's API. -
OpenG PortIO throws error with no description
dadreamer replied to Eric.Craaybeek's topic in OpenG General Discussions
I used InpOut32 / InpOutx64 few times in the past. It's very simple to use, because the sys driver is already integrated into the dll and is extracted automatically upon a call, so the user has nothing to do besides calling the functions. But I have never tested it in Windows 10 and absolutely unsure, whether it will work or not. I see that the authour has obsoleted that project due to the need of signing, so no guarantee here. Also see the known issues in red. Moreover you might give a try to WinIo or NTPort , even though they are not so convenient to use. I did use WinIo before InpOut and it is signed with a self-signed certificate and can only be used when Windows is running in a "test" mode (when driver signature enforcement is disabled). I did not have any experience with NTPort, because it's rather old and shareware. upd: By the way, I've found my old speaker test, based on InpOut library. It still appears to work even on Windows 10 and LabVIEW 2020 (both 32- and 64-bit). I'm attaching it "as is" - for 32-bit LabVIEW currently, but you may easily switch to 64 bits by changing the CLFNs to inpoutx64.dll and placing this dll into data folder. If you have a motherboard built-in speaker, you'll hear the beeps, when pressing the gray button (excuse me for non-English UI). Speaker_lv8.6.rar -
OpenG PortIO throws error with no description
dadreamer replied to Eric.Craaybeek's topic in OpenG General Discussions
I'm sure, Rolf as the original author of this library will definitely give you a detailed answer about this issue. I would just ask, whether it's the case of calling the library in 64-bit LabVIEW or on 64-bit Windows. Because if yes, then it's not going to work - both ogportio.dll and ogportio.sys are 32-bit in the 4.x release dated 2011 and I don't see anything freshier. As to 1275 error - if it is a WinAPI error code, then its description should be something like this (according to MSDN) : You might try disabling driver signature enforcement to overcome this. -
Finally here it is. Refnum_to_Pointer-Linux.zip Refnum_to_Pointer-MacOS.zip Tested in LV 2020 on Ubuntu 20.10 and macOS Big Sur. It's assumed to work in 64-bit editions of LabVIEW only.
-
Maybe it's not what you are looking into, but did you consider using VI Tags to store, read and write the data? It's contained inside a VI in a dedicated resource section, so it will be inside an EXE after the building as well. It has one disadvantage though - you can't use OS tools to view and edit the data directly, but have to use LabVIEW/RTE to do that. If you're fine with it, then try to give it a go. https://zone.ni.com/reference/en-XX/help/371361R-01/lvprop/generic_m/ https://forums.ni.com/t5/LabVIEW/Darren-s-Weekly-Nugget-04-13-2009/m-p/888538?profile.language=en
-
NI abandons future LabVIEW NXG development
dadreamer replied to Michael Aivaliotis's topic in Announcements
I just hardly understand, how new features of NXG could be integrated into classic LabVIEW editions, given that a classic is written on C/C++, whereas NXG is made on C# mostly. It's also worth mentioning, that some code pieces of classic LabVIEW were not updated for decades, so it would take years literally to rework them and reimplement some NXG possibilities (as zooming, Unicode support etc). -
It's in the OP's first message. Then it's worth trying RTE 5.5 at least.
-
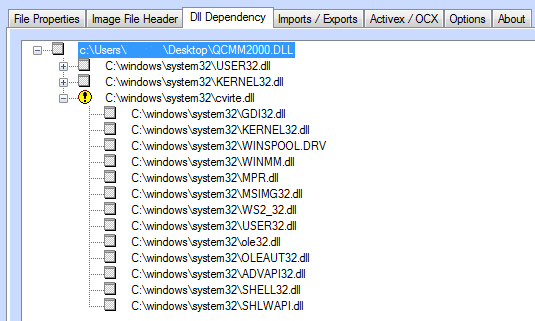
Might it be that LabWindows/CVI RTE should also be installed on a clean machine? DLL dependencies utility shows, that QCMM2000.DLL depends on cvirte.dll. I'm not sure, where you could download 4.0.1 RTE for LabWindows, it's not available on NI.com. Maybe try to request it from the vendor?..

-
LabVIEW "live" USB
dadreamer replied to Neil Pate's topic in Application Builder, Installers and code distribution
Definitely yes. I have done this many times for simple applications a la "Calculator" and it does work. Although for modern LV versions (starting from LV 2018 as I can remember) it has become more complicated, because universal CRT is used, that requires Microsoft Visual C++ 2015 Redistributable to be installed or a whole bunch of DLLs should be placed near the exe instead. -
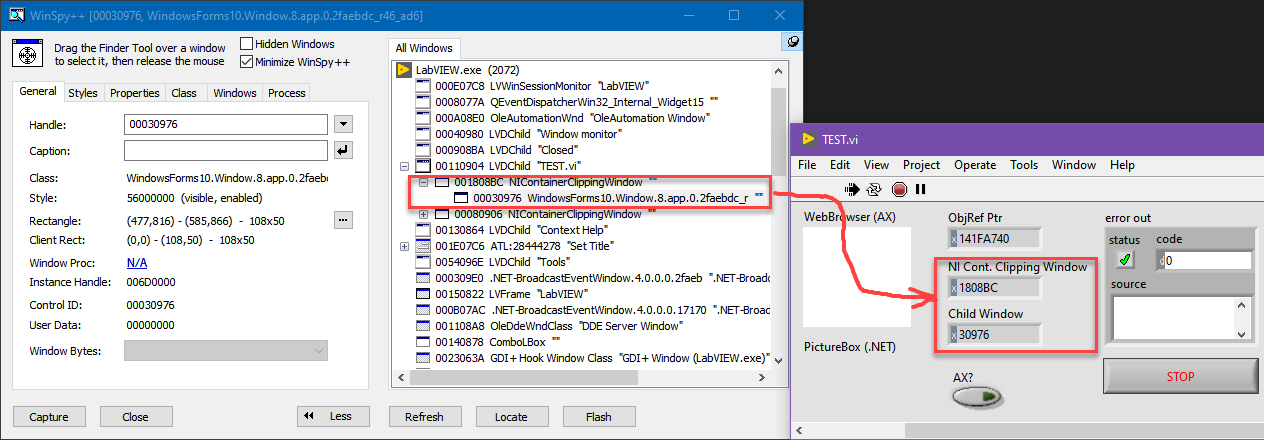
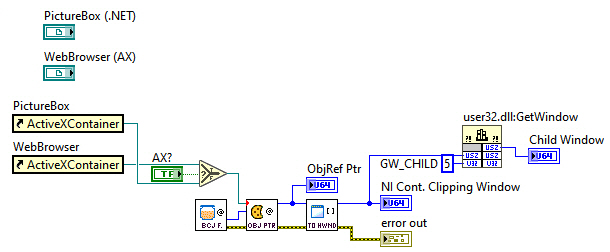
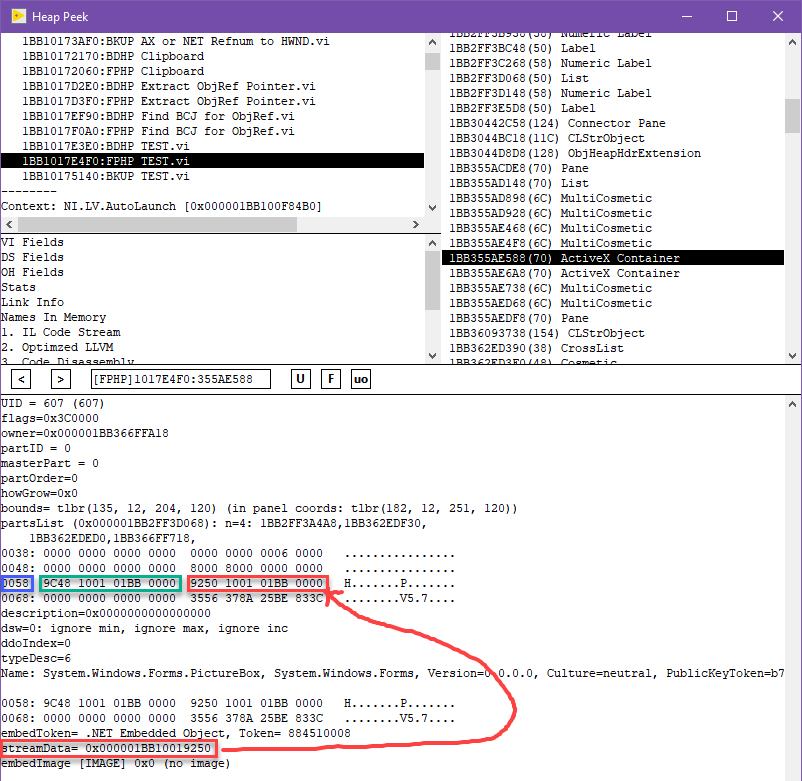
When I found a way to obtain the object's pointer given its refnum, I remembered my old and currently declined idea on NI Forums - Ability To Get .NET/ActiveX Window Handle By Its Automation Refnum. The solution proposed there is not good for many reasons, so I decided to see, whether I could pull out a HWND of NI Container Clipping Window from LabVIEW's internals using the object's pointer only. After some experiments I have succeded! So, now it's clear that LabVIEW retains that HWND in the memory to be able to do some manipulations with the window (like resizing / moving etc.). Okay, here's my VI for getting a HWND from ActiveX or .NET Refnum. It requires Find BCJ for ObjRef.vi and Extract ObjRef Pointer.vi from this thread. ActiveX_NET_Refnum_to_HWND.rar Tested this on every LabVIEW version from 2009 to 2020 (both 32- and 64-bit and both IDE and RTE). There are some constant offsets hardcoded on the diagram, therefore it's not guaranteed to work in the upcoming LabVIEW releases. But on practice only the one offset could change and it's easy to find it out with Heap Peek. To do this (if needed): Place ActiveX or .NET object onto the panel and launch Heap Peek. Choose FPHP and find ActiveX Container in the objects list on the right (use F button to see the object). In the object's data space find streamData pointer (marked red on the picture below). You need the address right before this pointer (marked green). The offset, you want, is written on the left of the dump (marked blue). Just use this offset with your LV version and you're done.
-
Did you know that this option shows "Autopreallocate arrays and strings" checkbox on VI Properties -> Execution tab? Here's the excerpt from the LabVIEW Help about this setting.
-
Calling arbitrary code straight from the diagram
dadreamer replied to dadreamer's topic in LabVIEW General
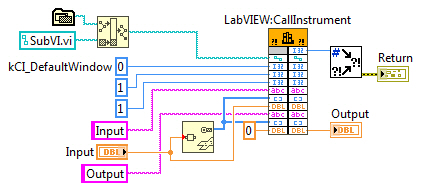
Nice catch, Rolf! It works and I am able to pass the input/output parameters now. RunVI.vi SubVI.vi But it appears that CallInstrument wants to be ran in UI Thread only, else LabVIEW goes big crash. It calls the VI synchronously, waiting until it finishes. That makes me think that this function is not the best idea to use as a callback, because when the user will be interacting with some GUI elements or the program will be running some property/invoke nodes, the callback VI will be waiting UI Thread to become idle, thus we could experience the delay between the events from our callback (or even loss of earlier ones?). It would be much better to run the VI in any thread somehow, but CallInstrument doesn't support that. That's why I decided not to adapt the asm samples for that function for now. Maybe I would be lucky enough to find some other options or overcome the threading issues somehow. Or end on PostLVUserEvent until some better ideas come to mind. 🙂 It's likely has to do with these two functions: GetCIntVIServerFuncs and GetCInterfaceFunctionTable. They return some tables, filled with the function pointers. There are InitLVClient / InitLVClient2, UninitLVClient / UninitLVClientNoDelay, WaitLVClientReady, WaitLVShuttingDown and a whole bunch of unnamed functions (safety precautions?). It'll take a serious effort to study how those work.
-
I have not, but I just tried and saw no difference in passing strings into CLFN (no matter, if variable, bounded or fixed length). I think, it could be some archaic setting for early LVs before 2009. It even doesn't cause a VI to be recompiled unlike "Type Only Argument" option. It just adds 0x40000 to the flags field in the terminal's DCO properties. Having played with that flags field a little, I can conclude, that it affects IDE behaviour and the terminal look only (to accept some wire(s) or not), but has nothing to do with the compiled code execution. For example, with value of 0x30000 I'm getting this. These tokens should be added to this thread for sure.
-
Calling arbitrary code straight from the diagram
dadreamer replied to dadreamer's topic in LabVIEW General
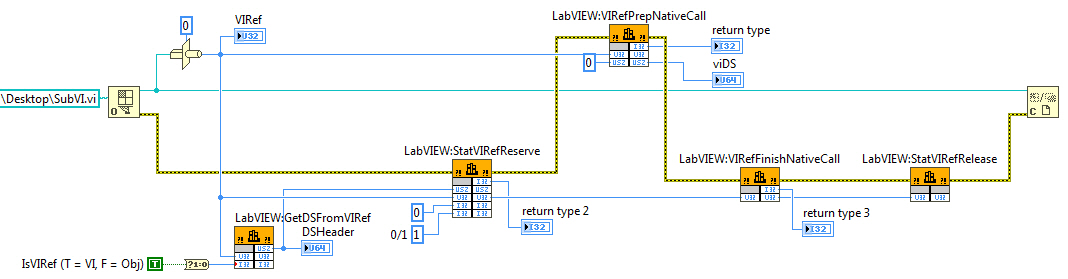
I'm afraid, we can't use them, because they don't actually run a VI, but "prepare" its state for a run. I guess it's used only for LabVIEW Adapters to be called later from TestStand. VIRefPrepNativeCall requires a VI to be in reserved state, otherwise it returns 1027 error. If we mark the VI as reserved with StatVIRefReserve, then it all goes OK, but the target VI is not executed. Something like this: int32_t StatVIRefReserve(uintptr_t viDS, uint32_t *pVIRef, int32_t unknown, int32_t setUnset); int32_t VIRefPrepNativeCall(uint32_t viRef, uintptr_t *pVIDS); int32_t VIRefFinishNativeCall(uint32_t viRef); void StatVIRefRelease(uint32_t viRef); There must be something between VIRefPrepNativeCall and VIRefFinishNativeCall like NCGRunVirtualInstrument, but with the ability to pass the parameters. Of course, we could use WriteDCOTransferData before the call to set our parameters, but the BD / assembly code becomes kinda cumbersome then.
-
Calling arbitrary code straight from the diagram
dadreamer replied to dadreamer's topic in LabVIEW General
All I could find about this is just these two internal functions: CallVIFromDll NCGRunVirtualInstrument For the first one I was able to find .NET prototype only: CallVIFromDll.Invoke(Int32 epIndex, IntPtr lvClient, IntPtr entryPointDataSpace) I'm kind of unsure, how it could be used for the mentioned task. It looks like it doesn't accept the VI parameters. And what do these arguments mean exactly?.. As to the second one, it doesn't accept the VI parameters as well and must be called in UI Thread only. The prototype is as follows: int32_t NCGRunVirtualInstrument(uint32_t VIRef); I did a limited testing and it appears to work. The VI is launched with the parameters on its FP and no panel is shown. We could prepare the parameters before the call with Control Value.Set method. Not very flexible solution, as I think. I saw your post from 2016, where you said that you have found some functions suitable for the task. Do you remember the details? -
A few WinAPI calls are used there. Besides of that I suppose that assembly blocks should be altered and the hard-coded offsets should be checked as well. It all needs a time to debug on those platforms. I have VMs for Linux/macOS on one machine only, so... Do you really need this on Linux or macOS?
-
It took a while to code it, but here it is finally. 😉 I have found a way to retrieve the object's pointer soon after the last post in this thread, but had to debug and test everything. Refnum_to_Pointer.rar How it works: As we don't have any public or private API to obtain Base Cookie Jar (BCJ) pointer (that is a LabVIEW global variable), the only way is to examine some function, which uses it, find the place with this global and save the pointer. Actually, this is how we're getting our BCJ. To clarify, it's for Object References only, not for any other references out there. After we've got BCJ, we call MCGetCookieInfo and get the information, associated with that refnum. As far as I understand, CookieInfo appears to be a C++ class with a few methods and properties (not just an ordinary struct). One of the methods is able to extract the object's pointer from VI DS. Further we call that unnamed method, using the hard-coded offset of 0xC (for 32 bit) / 0x18 (for 64 bit) and it returns the necessary pointer. The method should be called using __thiscall convention, that is why I'm using the technique described here. I decided not to write a wrapper library, so that everyone everywhere could easily browse the code and alter it, when needed. Currently tested on all LabVIEW versions from 2009 to 2020 (both 32- and 64-bit, both IDE and RTE). It won't work on anything earlier than LV 2009, because ExtFuncCBWrapper is absent there. Also no Linux or macOS at the moment, sorry. Oh, and it may become broken in the future LV releases. Or may not, nobody knows yet. 🙂
-
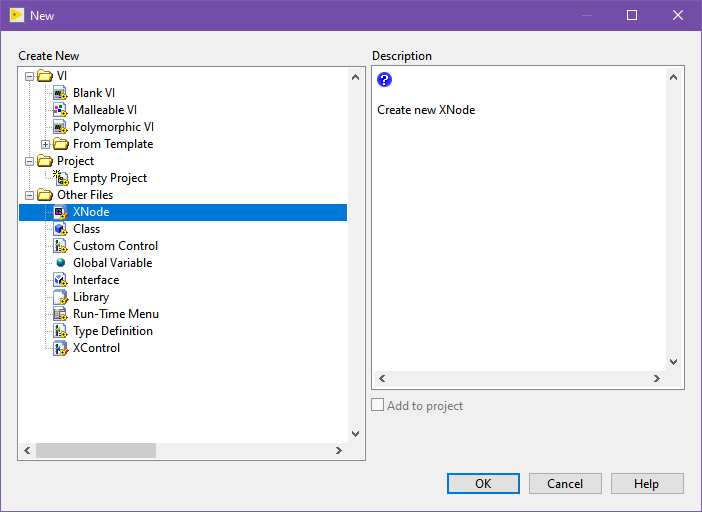
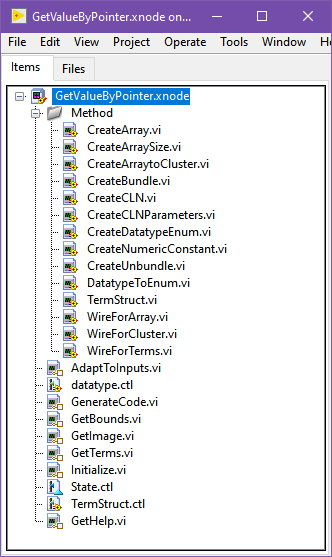
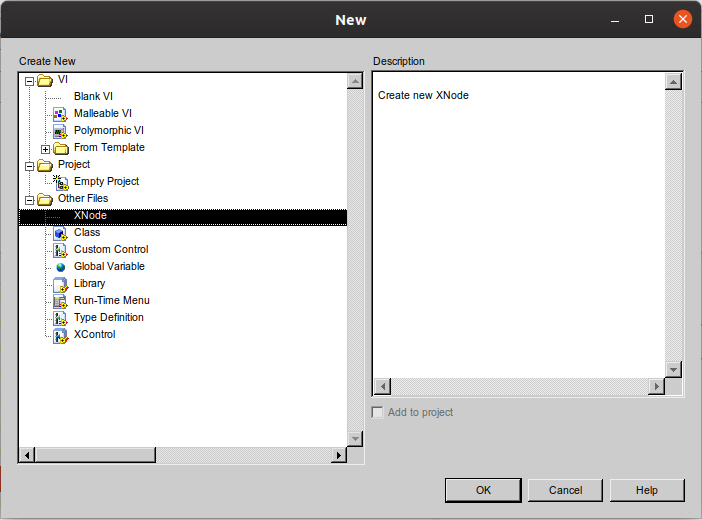
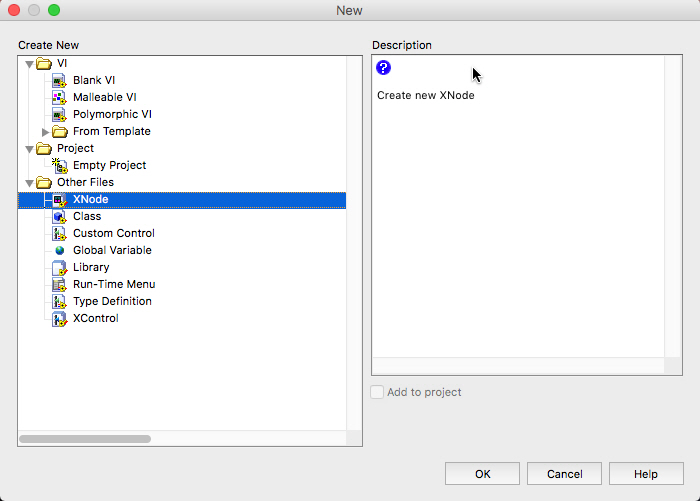
How to enable native XNode development on Linux/Mac
dadreamer replied to Sparkette's topic in VI Scripting
No, that XNodeDevelopment_LabVIEWInternalTag token doesn't make any effect in LabVIEW for Windows. Moreover it even isn't contained in the executable. -
How to enable native XNode development on Linux/Mac
dadreamer replied to Sparkette's topic in VI Scripting
And this is for Windows 😉 I don't want to violate the rules, therefore I'm not going to describe how to achieve this functionality on Windows. If you really want to get it, take a closer look at those Scripting packages, find .lc there, then alter PACKAGE / INCREMENT tokens to LabVIEW_XNodeDevelopment_PKG and COMPONENTS token to LabVIEW_XNodeDevelopment in it. Sure you know what to do next.
-
How to enable native XNode development on Linux/Mac
dadreamer replied to Sparkette's topic in VI Scripting
You are right, I managed to successfully activate LabVIEW XNode entries with XNodeDevelopment_LabVIEWInternalTag=True token. Here are the screenshots taken on Ubuntu w/ LV 2019 64-bit. And these are from Sierra w/ the same LV. In my case the preferences file was here: - /home/<user name>/natinst/.config/LabVIEW-<LV version>/labview.conf (on Linux); - /Users/<user name>/Library/Preferences/LabVIEW.app <LV version> 64-bit Preferences (on macOS).
-
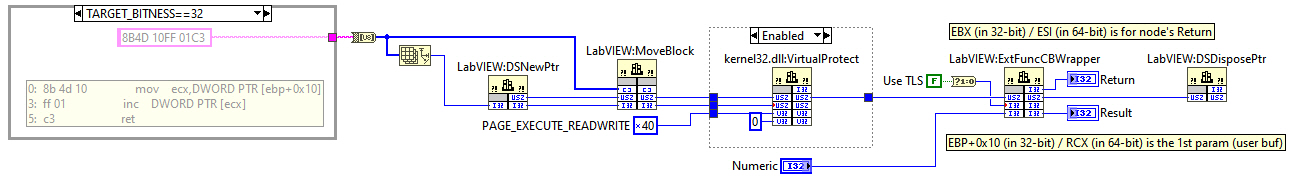
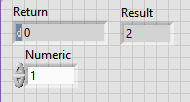
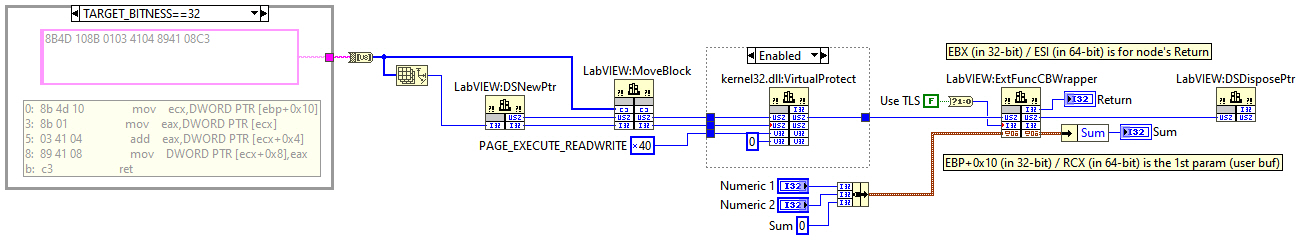
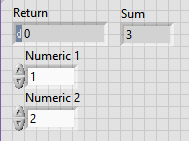
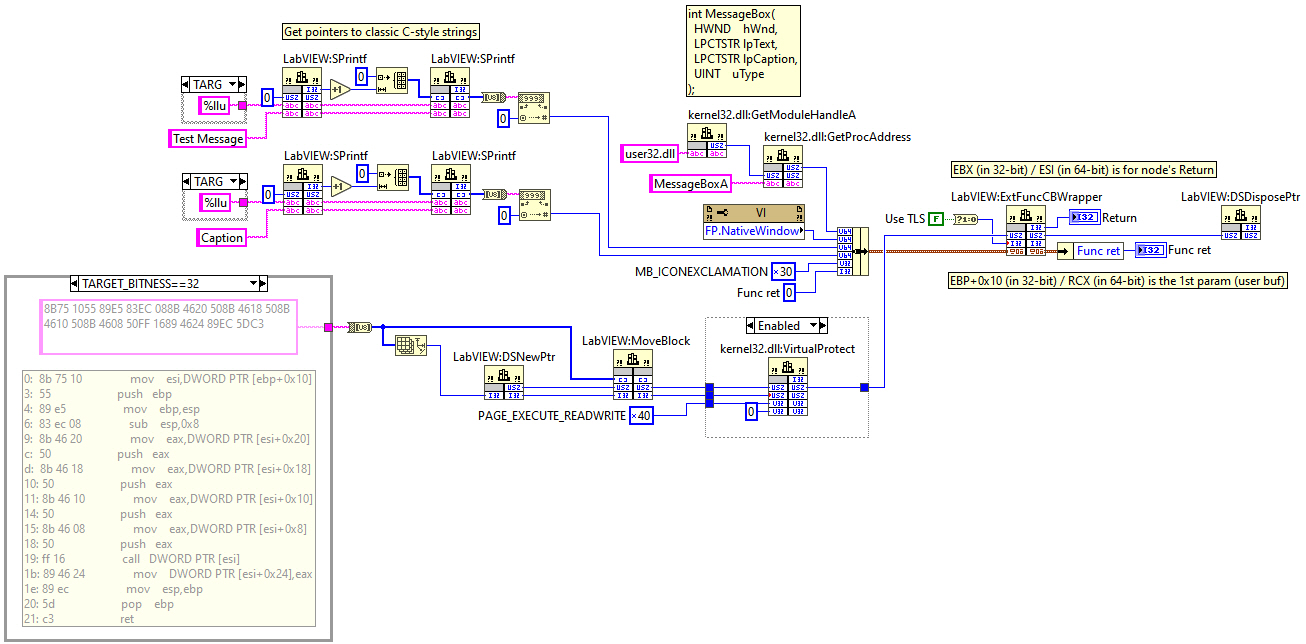
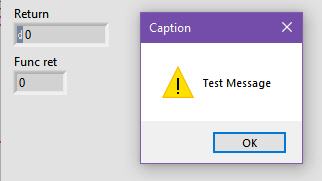
I want to remind once again that all this information is just to have fun playing with LabVIEW and not intended for real projects use. I believe you all understand that. 🙂 Not that a big opening here and even not an opening for some ones, but I found this interesting enough to make a thread. As you may already know, when some library is being called using CLF Node, LabVIEW enters ExtFuncWrapper first to do some guard checks to prevent itself from a silent crash and output some error message to the user instead. I've always considered that wrapper boring enough to study, thus never looked inside. But when once again I faced that I can't call some function through CLFN and have to write my own wrapper library, I asked myself why we cannot call some code by its pointer as in almost any well-known text language?.. Therefore I decided to know how ExtFuncWrapper calls the function. It turned out that ExtFuncWrapper receives the function's pointer (along with the parameters struct pointer) and calls that pointer later as it is (i.e., not doing any manipulations with it). So we can use it to call any function and even any code chunk directly from the diagram! After further research I found ExtFuncWrapper not very convenient to use, because to bypass some checks the parameters struct should be prepared accordingly before the call. But there are many ExtFunc... wrappers in labview.exe and ExtFuncCBWrapper is much easier to use. It has the following prototype: int32_t ExtFuncCBWrapper(uintptr_t CodeChunk, int32_t UseTLS, void *CodeParams); Here CodeChunk is our func / code pointer, UseTLS is 0 as we don't use LabVIEW's Thread Local Storage and CodeParams is our parameters struct. When called ExtFuncCBWrapper runs that CodeChunk, passing CodeParams to it, so we can freely use it later to do what we want. Nuff said, here are the samples. This one increments a Numeric. ExtFuncCBWrapper-Increment.vi As you can see, I'm passing a Numeric value as CodeParams pointer into ExtFuncCBWrapper and in the assembly I have to pull that pointer out to deal with my parameters. I'm not that excellent in asm codes, so I used one of many online x86 compilers-decompilers out there. It's even simplier in 64-bit IDE as the first parameter is already written into RCX. Okay, here goes a more advanced example - it calculates a sum of two input Numerics. ExtFuncCBWrapper-SumOfTwo.vi Here I'm passing a cluster of three parameters as CodeParams pointer (two Numerics and the resulting Sum) and in the asm I'm grabbing the first parameter, adding it to the second one and writing the result into the third one. Pretty simple operations. Now let's do some really wild asm on the diagram! 😉 The latter example calls MessageBox function from user32.dll. ExtFuncCBWrapper-MsgBox.vi This is what Rolf calls a diagram voodoo. 😃 I have to provide 4 parameters to MessageBox, 2 of which are string pointers. Thus I'm getting these pointers and writing them into my params cluster (along with the panel handle and the dialog type). When ExtFuncCBWrapper is called, in the asm code I have to use the prologue and epilogue pieces to prevent the stack corruption as I'm pushing 4 parameters later onto the stack to provide them to MessageBox. After the call I'm writing the result into the function return parameter. In 64-bit IDE the prologue/epilogue is somewhat simplier. Maybe you already noticed that I'm doing VirtualProtect before calling ExtFuncCBWrapper. This is done to pass through Windows Data Execution Prevention (DEP) protection. I'm setting execute and read/write access for the memory page with my code, otherwise LabVIEW refuses to run my code and throws an exception. Surprisingly it is thrown only in 64-bit IDE, but in 32-bit LV I can just wire the U8 array to ExtFuncCBWrapper, not going through that DSNewPtr-MoveBlock-VirtualProtect-DSDisposePtr chain. I did not start to figure out such a behaviour. Well, to be honest, I doubt that someone will find all these samples really useful for his/her tasks, because these are very low-level operations and it's much easier to use a common CLFN or a helper DLL. They are here just to show that the things described are definitely doable from an ordinary diagram, and that doesn't require writing any libraries. With a good asm skills it's even possible to realize callback functions or call some exotic functions (like C++ class methods). Some things might be improved also, e.g. embedding a generic assembly compiler to have a possibility to write the codes instead of raw bytes on the diagram. Ideally it's even possible to implement an Inline Assembly Node. Unfortunately, I have neither the time nor much desire to do it myself.
-
It's available on Web Archive as well.
-
Common Error and Fix - LabVIEW caught fatal signal
dadreamer replied to Jim Kring's topic in LabVIEW Bugs
That article is available on Web Archive.