
X___
-
Posts
443 -
Joined
-
Days Won
29
Content Type
Profiles
Forums
Downloads
Gallery
Everything posted by X___
-

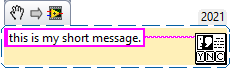
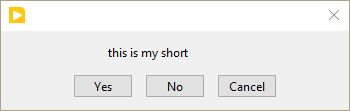
Three Button Dialog truncates message or adds "Standard" at the end
X___ replied to X___'s topic in LabVIEW Bugs
Thanks for the feedback Looking into the code of the Three Button Dialog Core.vi, I found a conditional case structure messing up with the displayed string which I must have added in a late night debugging session and forgotten about. Disabling it restored the expected behavior. For a while I thought that LabVIEW had been spooked... -
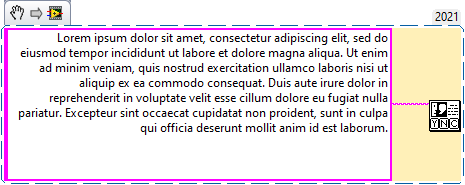
Here is the output: No better luck with long messages: here is the result: notice the "Standard" added to the text. Windows LV 2021 SP1 64 bit

-
We need to be realistic and pragmatic.
-
Koolaid? Not really. I like the sifting through stackexchange, distilling it to the necessary stuff and providing link to the source in case of doubts. PIL does return custom metadata (at least text ones) just fine.
-
No, it did not. It did mention that groupdocs was not free though! What puzzles me is that it did not mention that this was a standard feature of the python PIL package: from PIL import Image import matplotlib.pyplot as plt filename = '/content/drive/MyDrive/my image.png' # point to the image im = Image.open(filename) im.load() plt.imshow(im) plt.show() print(im.info) print('Metadata Field: ', im.info['Metadata Field']) which is probably the approach I will use in my migration to Python experiment.
-
This is going away from the original topic, but after a bit of trial and error (and prodding of ChatGPT), I came to the conclusion that there is no other way, in order to extract custom metadata from a PNG file, than to write a custom parser, as .NET only provides access to a series of predefined tags: https://learn.microsoft.com/en-us/dotnet/desktop/winforms/advanced/how-to-read-image-metadata?view=netframeworkdesktop-4.8 https://learn.microsoft.com/en-us/dotnet/api/system.drawing.imaging.propertyitem.id?view=dotnet-plat-ext-7.0 There is a third party .NET framework to achieve that goal (https://products.groupdocs.com/metadata/net/extract/png/) but at $1,700 a year per license, I guess the motivation isn't there...
-
Thanks. I wished I could, but the link I posted only provides the snippet.
-
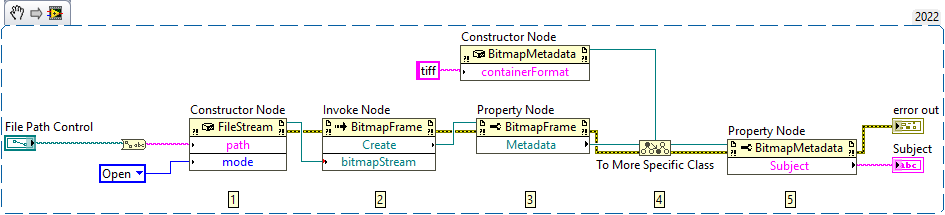
I found this .NET example as a potential path to circumvent requiring to have Python installed to read PNG metadata: https://knowledge.ni.com/KnowledgeArticleDetails?id=kA03q0000019lbVCAQ&l=en-US Unfortunately, I don't use 2022 (subscription). Would any one be so kind as to down convert it to 2021? Thanks!
-
Including solicitation of interest from potential acquirers
X___ replied to gleichman's topic in LAVA Lounge
... and LabVIEW for macOS is dead (but with a permanent license). -
What is a record number of attendees in metric units? BTW, the program looks interesting. Will it ever get online and will code be shared?
-
Where is the popcorn emoji when you need it?
-
Well, isn't Linux part of Windows nowadays?
-
Here is ChatGPT's answer: You can delete part of a file without loading it entirely into RAM by using the dd command. This command can be used to move the contents of the file up by a specified number of bytes, effectively deleting the specified number of bytes from the beginning of the file1. Here is an example script that you can use to delete a specified number of bytes from the beginning of a file: #!/bin/bash size=$(stat -c %s "$2") dd bs=$1 if="$2" skip=1 seek=0 conv=notrunc of="$2" dd bs=$((size - $1)) if="$2" skip=1 seek=1 count=0 of="$2" Copy You can call this script as ./truncstart.sh 2 file.dat, where 2 is the number of bytes to delete from the beginning of file.dat1. However, please note that this solution is not robust in case of an unplanned outage, which could occur part-way through dd’s processing; in which case the file would be corrupted1. Is there anything else you would like to know? 😊 Learn more: 1. unix.stackexchange.com2. superuser.com3. digitalcitizen.life
-
LabVIEW deep reinforcement learning is upcoming !!!
X___ replied to Youssef Menjour's topic in Announcements
It looks like the Russians took your motto too literally: "Our idea is to help our novice users to start simply with machine learning and then hit the moon !" -
Including solicitation of interest from potential acquirers
X___ replied to gleichman's topic in LAVA Lounge
Yes. I wonder what the next 100 years of engineering that ambitiously will change to this picture. -
Including solicitation of interest from potential acquirers
X___ replied to gleichman's topic in LAVA Lounge
$37M/quarter at $2.5K a license/year, that's ~60,000 yearly licenses (assuming all are LabVIEW Pro only). -
Including solicitation of interest from potential acquirers
X___ replied to gleichman's topic in LAVA Lounge
Precisely. -
Including solicitation of interest from potential acquirers
X___ replied to gleichman's topic in LAVA Lounge
Emerson is busy leveraging its upcoming integration of LabVIEW in all aspects of its business: https://www.emerson.com/en-us/news/2023/07-emerson-exchange-immerse-2023-registration-open https://www.emerson.com/en-us/news/2023/emerson-to-acquire-flexim https://www.emerson.com/en-us/news/2023/emerson-to-acquire-afag -
Pretty much anything is possible. Some tasks may require some know-how, most a lot of trial and error. If you haven't checked it out, you may want to look into the Vision Development Toolkit (and its associated Vision Assistant), as it has a bunch (lots) of functions to process and analyze images. But again, you will have to do your own research and experimenting. Wait a few years and you might be able to ask this to L"AI"BVIEW and it will be done automagically.
-
I don't think it will work so well with green PCBs. Now if the boards were blue, however...
-
Nice catch on the type specialization structure (or other structures). Obviously I discovered this playing around with a disable structure and did not bother investigating further.
-
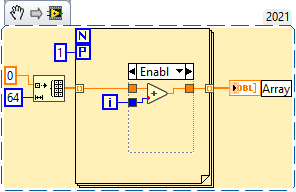
Hopefully the diagram is simple enough to reproduce... The parallelization options have a maximum number of 16 parallel loops, but this doesn't really play a role in this discussion. As far as "native function", it is native in the sense that you can enable debugging. The only catch is that it is fairly subtle to see that this is enabled (the P terminal is lightly grayed out). It might be a simple matter of enhancing the visual feedback of this option: maybe draw a red cross on the "P"?
-
I am not sure whether this has been discussed before, but I stumbled upon a simple (alternative) trick to debug parallelized loops that may be of interests to others. Of course there is always the option to edit the parallelism settings and check the "Allow Debugging" box. The "P" terminal is slightly grayed out and parallelism is turned off until the user changes the settings back to not "Allow Debugging". I find it easy to forget or even fail to notice that a parallelized loop is in "Debug" mode due to the very subtle cue that parallelism is turned off. Generally, it is the degraded performance of the code that will trigger a question and then once is off to a rabbit chase for the culprit... A potentially useful trick is to do what is illustrated below: The code inside the loop is encompassed by a disabled structure (set to "Enabled") and the degree of parallelism set to 1. Note that it is not necessary to edit the Loop Parallelism settings! I find the visual cues much easier to notice (and the code easy to revert to full parallelism). Note that it is possible to use a different P value, but in that case you will miss the majority of loops and the actual loop that will be debugged appears to be somewhat random (I have some idea about which ones are, but this is pure guess). This might fit your needs. Once debugged, it is pretty obvious that the parallel loop is not truly "parallel" anymore, and therefore it is hard to forget to revert to a fully parallelized state. HTH.
-
Bookmarks in malleable VIs do no show up in the bookmark manager
X___ posted a topic in LabVIEW Bugs
Observed in LabVIEW 2021 SP1f4 Windows 10 64 bit. -
Bug/Documentation Error in Continuous Random VI: Gamma Random
X___ replied to X___'s topic in LabVIEW Bugs
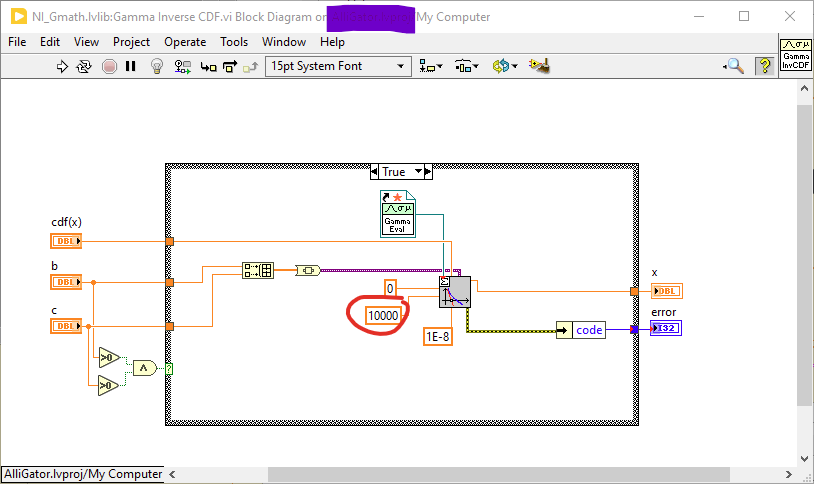
Another fun bug of this function is that it arbitrarily cuts off generation at 10,000: Why not? It always spices up debugging... (the revision history shows: rev. 2 Sun, Sep 25, 1994 12:46:16 PM greggf)