Leaderboard
Popular Content
Showing content with the highest reputation on 11/22/2011 in all areas
-
I briefly mentioned a logging API that I've been using for logging errors, warnings etc to a SQLite database in the NLog thread. Since it seemed to be of interest, I thought I'd knock together a demo so that peeps could see how I use it and demonstrate some of the features using database enables above and beyond boring old text file logs (it requires the SQLite API for Labview installed) So here she is..... If people approve and think it's useful, I will add it to the SQLite API for Labview as an example.3 points
-
When I say the queue buffer contains all the elements, that just means the top level of the data. For arrays that is just the handle. In your example I see it get close to 1.5 million elements. This means the queue buffer is only around 6MB. You actually seem to be off on the total memory calculation though. Each of your 128 uInt64 arrays is about 1K. That means that 1.5 million is 1.5GB. That puts you very close to the 1.7GB of usable address space and much higher than your estimated 150MB. I hadn't actually built the VI when I replied the first time so my focus on fragmentation was based on the low 150MB number. This appears to be more about actual usage than fragmentation. If you want to see what happens when the data really is flat inside the queue buffer, try putting an array to cluster after your initialize array and set the cluster size to 128. This produces the same amount of data as the array but it will be directly in the queue buffer. You will get a much smaller number of elements before stopping. The out of memory dialog is displayed by LabVIEW not by the OS. The problem is this dialog is triggered at a low level inside our memory manager and at that point we don't know if the caller is going to correctly report the error or not. So we favor given redundant notifications over possibly giving no notification. This does get in the way of programmatically handling out of memory errors, but this is often quite difficult because anything you do in code might cause further allocation and we already know memory is limited. I guess I forget that a lot of people limit their virtual memory size. This does affect my earlier comments about the amount of usable address space available to each process. This does put a limit on total allocations across all processes, so the amount available to any one process is hard to predict. Vision was the first to be supported on 64-bit because it was seen as the most memory constrained. Images are just big and it is easy to need more memory than 32-bit LV allows. Beyond that it is just a matter of getting it prioritized. Personally, I'd like to see parity or even 64-bit taking the lead. As sales and marketing continue to hear the request and we see users using 64-bit OSs, we should get there.2 points
-
So I've run into a VIPM vipc issue a few times, and I want to get everyone's opinion - maybe I'm missing something? Please take a look at this idea on the JKI Idea Exchange and add comments over there.1 point
-
1 point
-
@above all : You guys are right when I read my questions again I feel I am asking on a broad perspective. I will target my questions to a specific problem. This is possible only when I do things. The usual problems with beginner I will be back when I hit some hard stone. Thanks guys1 point
-
1 point
-
Thank you, that works. Strangely, it is exactly what I was wanting to do in the first place, had I known (or remembered) that the INDEX ARRAY widget could be pulled down for multiple lines out (versus indexing one at a time inside a loop). For the cluster function, that much is obvious in the visual icon, and was the only reason I was going with clusters for this particular sub VI. Problem is I am allowed to do LabVIEW only seldom (even though I'm the designated 'guru' [coughs embarassedly] for all things LabVIEW) and usually only with other engineers waiting anxiously for me to update whatever it is that needs addressing. Thanks to everyone who replied.1 point
-
Pardon the book, but let me try to clarify some concepts here. The question of how much memory was free on the machine running the test is irrelevant. All desktop operating systems use virtual memory so each process can allocate up to its address space limit regardless of the amount of physical RAM in the machine. The amount of physical RAM only affects the speed at which the processes can allocate that memory. If RAM is available, then allocation happens fast. If RAM is not available, then some part of the RAM content must be written to disk so that the RAM can be used for the new allocation. Since the disk is much slower than RAM, that makes the allocation take longer. The key is this only affect speed not how much allocation is required to hit the out of memory error. Just because the task manager still says LabVIEW is using a bunch of memory doesn't mean that LabVIEW didn't free your data when your VI stopped running. LabVIEW uses a suballocator for a lot of its memory. This means we allocate large blocks from the operating system, then hand those out in our code as smaller blocks. The tracking of those smaller blocks is not visible to the operating system. Even if we know that all those small blocks are free and available for reuse, the operating system still reports a number based on the large allocations. This is why even though the task manager memory usage is high after the first run of the VI, the second run can still run about the same number of iterations without the task manager memory usage changing much. Since the amount of memory LabVIEW can allocate is based on its address space (not physical memory), why can't it always allocate up to the 4GB address space of a 32-bit pointer? This is because Windows puts further limitations on the address space. Normally Windows keeps the top half of the address space for itself. This is partially to increase compatibility because a lot of applications treat pointers as signed integers and the integer being negative causes problems. In addition to that the EXE and any DLLs loaded use space in the address space. For LabVIEW this typically means that about 1.7 GB is all the address space we can hope to use. If you have a special option turned on in Windows and the application has a flag set to say they can handle it, Windows allows processes access to 3GB of address space instead of only 2 so you can go a little higher. Running one of these applications on 64-bit Windows allows closer to the entire 4GB address space because Windows puts itself above that address. And then of course running 64-bit LabVIEW on a 64-bit OS gives way more address space. This is the scenario where physical RAM becomes a factor again because the address space is so much larger than physical RAM and performance becomes the limiting factor rather than actually running out of memory. The last concept I'll mention is fragmentation. This relates to the issue of contiguous memory. You may have a lot of free address space but if it is in a bunch of small pieces, then you are not going to be able to make any large allocations. The sample you showed is pretty much a worst case for fragmentation. As the queue gets more and more elements, we keep allocating larger and larger buffers. But between each of these allocations you are allocating a bunch of small arrays. This means that the address space used for the smaller queue buffers is mixed with the array allocations and there aren't contiguous regions large enough to allocate the larger buffers. Also keep in mind that each time this happens we have to allocate the larger buffer while still holding the last buffer so the data can be copied to the new allocation. This means that we run out of gaps in the address space large enough to hold the queue buffer well before we have actually allocated all the address space for LabVIEW. For your application what this really means is that if you really expect to be able to let the queue get this big and recover, you need to change something. If you think you should be able to have a 200 million element backlog and still recover, then you could allocate the queue to 200 million elements from the start. This avoids the dynamically growing allocations greatly reducing fragmentation and will almost certainly mean you can handle a bigger backlog. The downside is this sets a hard limit on your backlog and could have adverse affects on the amount of address space available to other parts or your program. You could switch to 64-bit LabVIEW on 64-bit Windows. This will pretty much eliminate the address space limits. However, this means that when you get really backed up you may start hitting virtual memory slowdowns so it is even harder to catch up. You can focus on reducing the reasons that cause you to create these large backlogs in the first place. Is it being caused by some synchronous operation that could be made asynchronous?1 point
-
Well, I've tracked this down to an issue being brought on to using classes within a LabVIEW library. The two kinds of libraries (.lvlib and .lvclass) just plain do not work together. My little project's classes became plain uneditable, they were contained in an lvlib. In a fit of frustration, I dragged the entire lvlib hierarchy out of the library scope, and magically everything just works as intended. This is a shame, for lvlibs offered a lot of control and namespacing which really helps with code reuse. Please to any at NI who are reading this thread, fix this. Well, it's a good thing I got this working. I'm literally down to the last hours, about to be gone for two weeks and this code has to work by end of day. Meanwhile, I just lost two hours trying to add a simple primitive to one of my classes. Since there's no way I'm going to drop my use of .lvclass objects, I'm done with lvlibs for now.1 point
-
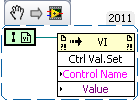
You could use OpenG's "Get Current VIs Parents Reference" to get a reference to the main VI and then use an invoke node to get/set the control's values using their label. The other option at the top of by head is to make an array of the references to pass into the subVI and the index of which control changed. Then use a for loop to set the others.1 point
-
jgcode made an Error Logger as part of last year's NI Example Code Contest.1 point
-
Well you can convert C algorithmes quite easily into the formula node as that one supports a subset of C. For whole C programs there is simply no way to translate that in a meaningful way into a LabVIEW program by automatic and in fact even translation by humans is mostly an exercise in vain as the runtime concepts are quite different. And if a human can't do it how could you come up with an algorithm that does it automatically. I'm not saying that you can't rewrite a C program in LabVIEW but that is not translation but simply reading specs (here from the C program) and writing a LabVIEW program from scratch. C is in no way as formal and strict as more modern design paradigmas such as UML etc. and I haven't seen LabVIEW code generators that can translate such design documents readily into LabVIEW VIs. If it is indeed simply the code generation part from the embedded Toolkit (and I'm almost 100% sure it is), then all I can say is: The code generation works but it ain't pretty to look at. Personally I don't see much use in generating simply C code. The embedded Toolkit makes some sense when used with a preconfigured tool chain for a certain target but just generating C code from LabVIEW code is not much more than for the wow effect. Converting a simple VI algorithme into C is quite a bit leaner and meaner when done by hand and converting complex programs is likely an exercise in vain as there are to many dependencies on the underlying runtime and OS environment that this could be done in a really generic way .1 point


