Search the Community
Showing results for tags 'labview'.
-
 I am just starting on trying to be able to use Python code from a LabVIEW application (mostly for some image analysis stuff). This is for a large project where some programmers are more comfortable developing in Python than LabVIEW. I have not done any Python before, and their seem to be a bewildering array of options; many IDE's, Libraries, and Python-LabVIEW connectors. So I was wondering if people who have been using Python with LabVIEW can give their experiences and describe what set of technologies they use.
 -
I have installed Labview 2020 on Dedian Buster using the rpm to deb conversion method via alien. Due to Architecture mismatch i deleted the *i386.rpm files before conversion. My Problem is that after creating a project at "Build Specification"-> "rigth click" i am only able to select "Source Distribution". Application does not show up as an option. I will be grateful for any suggestions. Thank you in advance.
-
.thumb.png.d7c7b190a318a5aa97c6dd482546d474.png) VIPM.io now allows you to post LabVIEW Resources, Ideas, and Tools. For example, you could post a link to a video tutorial or blog article about a package. You can also post ideas, like feature requests or new tools. Best of all, package developers are notified when you post your ideas and resources, and you can comment and discuss posts with the community. Take a look at this video to learn more: https://www.vipm.io/posts/664960df-f111-4e13-989a-24be8207182d/
VIPM.io now allows you to post LabVIEW Resources, Ideas, and Tools. For example, you could post a link to a video tutorial or blog article about a package. You can also post ideas, like feature requests or new tools. Best of all, package developers are notified when you post your ideas and resources, and you can comment and discuss posts with the community. Take a look at this video to learn more: https://www.vipm.io/posts/664960df-f111-4e13-989a-24be8207182d/
-
I want to connect My ccd camera with labview. The details of my system is given bellow. I cannot connect it please help OS: WINDOWS 7, 64bit LabView Run-Time 2013(64-bit) NI-IMAQ 4.8 NI-IMAQdx 4.3 Camera: QICAM Monochrome Cooled (QIC-F-M-12-C) Model QICAM Resolution 1392 x 1040 Sensor 1/2" Sony ICX205 progressive-scan interline CCD Pixel Size 4.65 x 4.65µm Cooling Type Peltier thermoelectric cooling to 25˚C below ambient Digital Output 12 bit Video Output FireWire (IEEE 1394b) Max. Frame Rate 10 fps full resolution @ 12 bits Pixel Scan 20, 10, 5, 2.5MHz Mount Type C-mount optical format
-
Hello everybody! Wondering how many people have tried the new vipm.io site. We have added a ton of features to make it easy to Discover LabVIEW Tools and there are some cool ones coming soon. Check it out and let me know what you think 😀 Javier
-
CLA_ATM_QMH_PRACTICE.zipHi Folks, I'm taking the CLA exam in a few weeks and would like some feedback on the solution I put together (attached). A few specific questions: Can I dump tags in the VI Documentation of the VI like I did in Error Handler - Console Error.vi and get credit since there are instructions for developers to complete this work? This would be my strategy if I run out of time. Does this seem like a passing solution? Why/why not? Where do you think I would lose the most points in this solution? Any other feedback on this exam or general strategy tips are greatly appreciated! Best Regards, Aaron
-
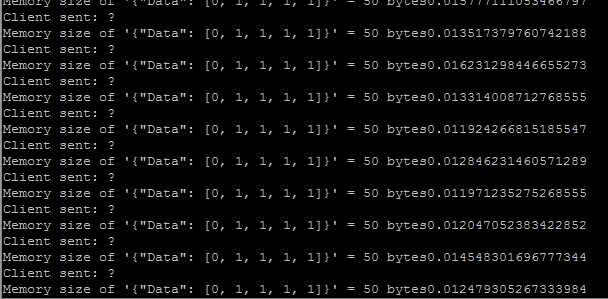
I am implementing a TCP connection between MyRio(client) and Python(server). The goal is to send data from the server to the client, perform some calculations, and send the result to the server. I need to keep changing the data being sent to the client. I noticed the first data works fine and the result returned to the server, but the client could not read subsequent data. I debugged and was able to detect that the error is coming from the first read function is the "Reading values subvi" but I don't know how to correct it. How do I go about it? I have attached the files below. Reading Unknown Bytes from TCP.vi Second_client.vi SimpleServer.py
-
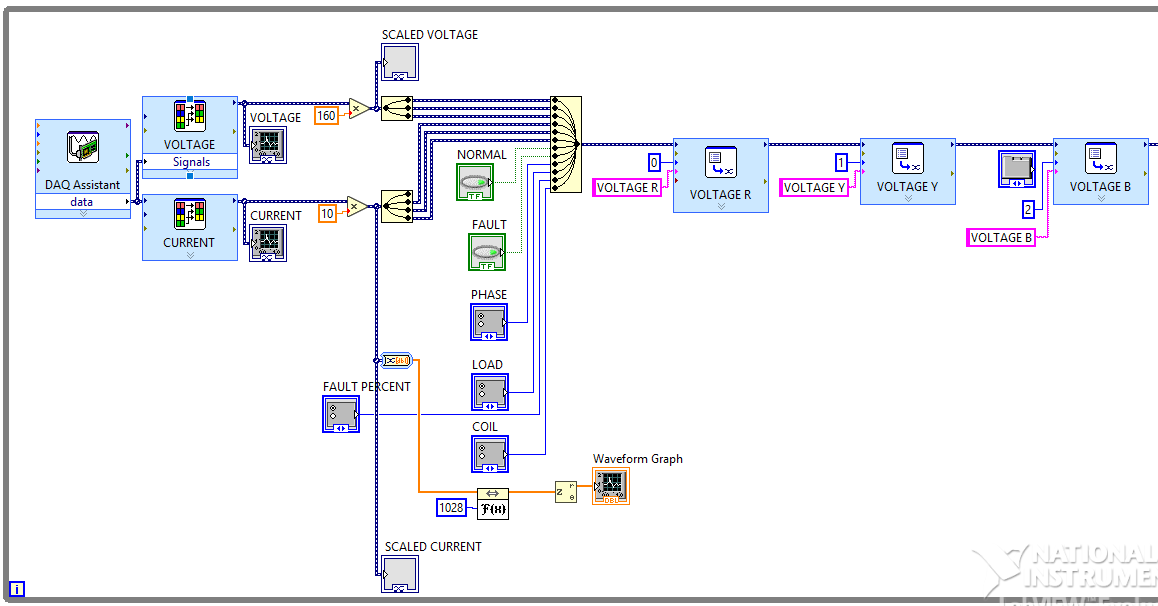
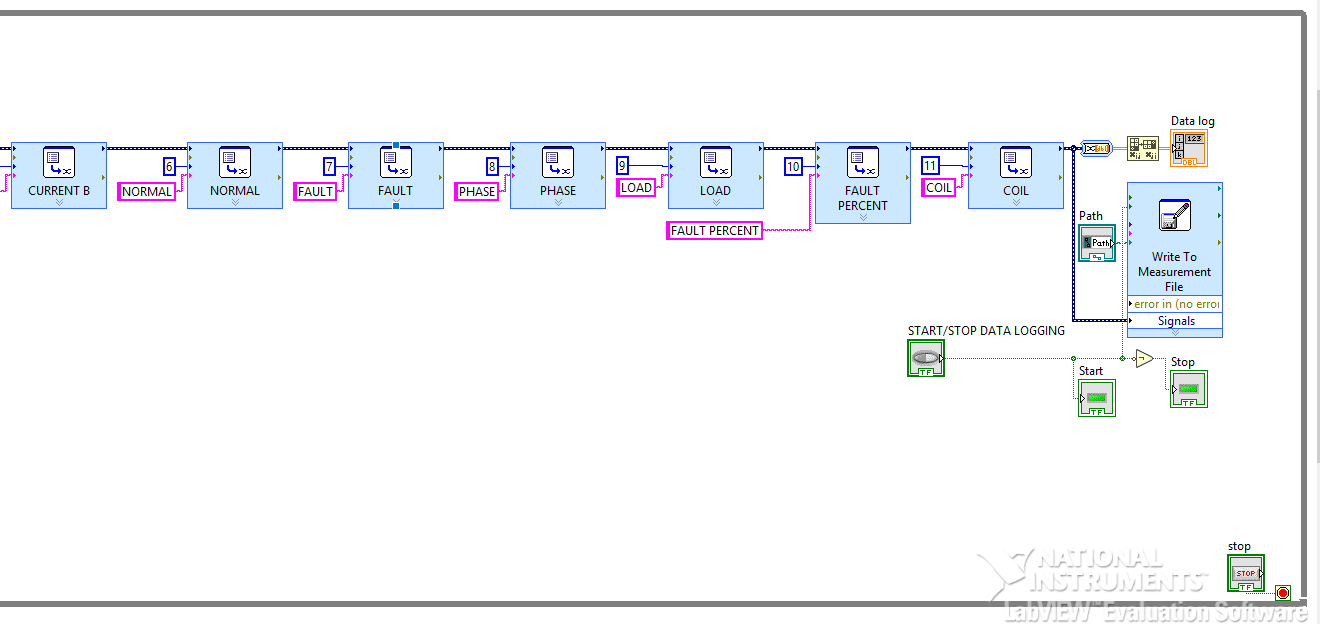
Hello I am quite new to labview and I have some questions regarding labview. We have came up with a simulation build in labview as shown in the folder. However, we will be making use of Myrio to connect current and voltage sensors to send the data to labview when labview is running. We are currently having difficulties trying to search if it is possible to send the wave files and the popout messages ( messagebox.vi and Player2Wins.vi) to NI Dashboard for Labview in Ipad by using myrio. Is it possible for myrio to store wave files and the additional VIs and sending these to NI Dashboard for Labview? Otherwise, it is possible for Labview to send the entire program.vi, messagebox.vi and Player2Wins.vi to cloud and people are able to see the GUI in program.vi remotely? ( We have found information like Labview web services etc. We hope that people are able to view our GUI and press the " Press start" button as well as closing the popout messages in a website not from our local network). I sincerely apologize if what I am asking does not make sense to people who are reading this. I hope that someone will help me with this as it is very difficult for me to do and I need some guidance from people who are familiar with these. Thanks for taking your time to read and your reply. Simulation_Build_(3).zip Pop-up_Message.vi Player2Wins.vi
-
Hello, i created a new tips repository in: https://edupez.com/ English and Portuguese
-
Hello Everyone, I have created this feature to create named variables of any data type in memory and access its value from any part of data code which is under same scope using its name. This variables stores instantaneous value. Best use case of this toolkit is acquire data set variable values & read from any loop. Do not use for Read-Modify-Write Once variables are created in memory, you can be grouped them and access its values using names. You can create variable for any data datatype & access its value using its Name. I have tested this toolkit for memory & performance, which is much faster than CVT & Tag Bus Library Please check and let me know your suggestions. use LabVIEW 15 sp1 BR, Aniket Gadekar, aniket99.gadekar@gmail.com DataVariableToolkit.zip
-
So I have a serious question. Does LabVIEW have a way (built in or library) of calculating the next larger or next smaller floating point value. C standard library "math.h" has two functions: nextafter, and nexttowards. I have put together a c function: that seems to do the trick nicely for single floats (well only for stepup): #include <math.h> #include <stdint.h> uint32_t nextUpFloat(uint32_t v){ uint32_t sign; = v&0x80000000; if (v==0x80000000||v==0){ //For zero and neg zero return 1; } if ((v>=0x7F800000 && v<0x80000000)||(v>0xff800000)){ //Check for Inf and NAN return v; //no higher value in these cases. } sign = v&0x80000000; //Get sign bit v&=0x7FFFFFFF; //strip sign bit if(sign==0){ v++; }else{ v--; } v=v|sign; //re merge sign return v; } I could put this in labVIEW, but these things are tricky and there are some unexpected cases. So its always better to use a reference.
-
So, I wanted to get an opinion here? I'm Pulling new values in from a device, and have UI elements change color depending on their value. This is of course done through property nodes. My question is what is better: A. Updating UI element only on value change (checking for value changes) B. Updating all UI elements all at once within a Defer front panel updates segment? ( and not checking for value changes) Thats all.
-
Hello, Im using Labview and im trying to get a single pixel color value of HSV starting on the x0 y0 coordinates from my picture, x1 y0, x2 y0, ... at the rows and then continue to columns. Where would i get the frequency of each color (0-255) on the whole picture at the table with one column for H => 0-255, S => 0-255 and V=> 0-255. But i need the frequency so i only need to add +1 everytime it appearce in there for each color to count it at the end (i need it for fuzzy later, to show my fruit has a good color and is ready to be harvested). Could you please help me with that? If you have any more questions about it , feel free to ask.
-
Hi everyone, I was forced to insert google (or equivalent) maps in a project and, for some time, I used Mohammad Garousi version (that I found the most complete version freely available on the web). It uses the GMap.NET dlls. After some time I noticed a recurring random issue at dll level, after which a red cross appears in the .net container without any chance to correct or avoid the error. After some time I decided to create a new map container that might solve the issue. I decided to use a picture instead of the .net container. I was able to add new functions too, like creating a route, customize its behavior (such as changing the route color to spectrum), or add another image moving with map position or zoom change and so over. The result is attached below. This is a full-working example that can be studied or modified at will, but still a demo and not a library or final release. User can move map dragging it inside the picture, can zoom with the slider and so on. Coordinates and cursor positions are updated live any time the cursor is in the picture area. You can draw a route enabling the draw button. Remember to set it off when drawing is over. You can add a third party image (the default one is a drone image) in the picture 0,0 position. You can easily customize the default position acting on the block diagram code. Any time you set the image button to on, the image will be placed to the 0,0 position, recalculating its latitude-longitude coordinates. You can dynamically change map representation, route color or zoom. I hope this example can be useful for those who need a more stable GIS representation. If any issues are discovered, please contact me. Bye Flavio LabGIS.rar
-
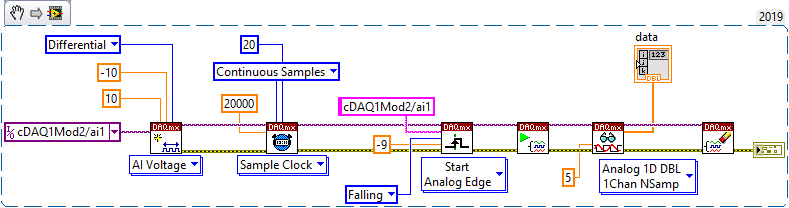
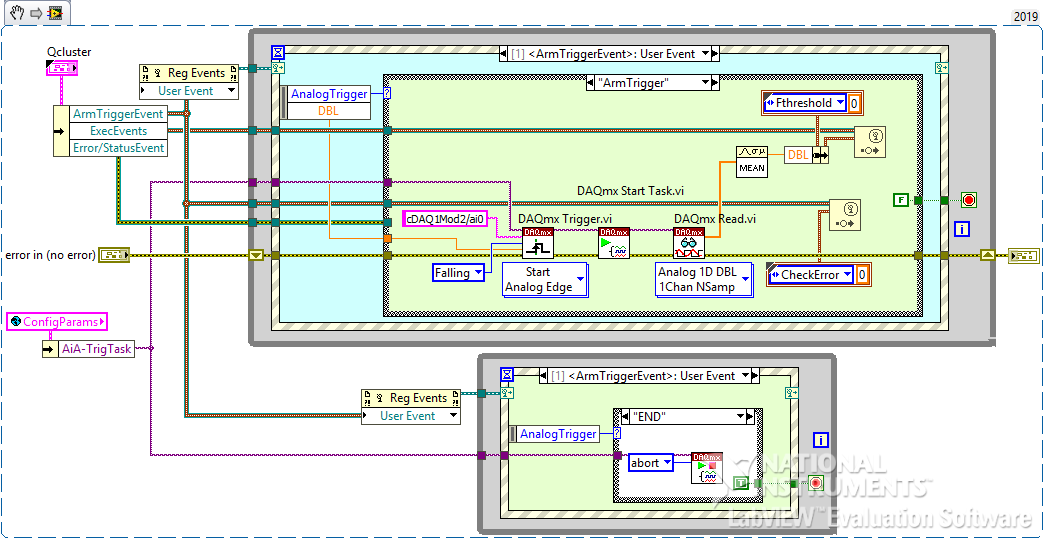
I have a requirement that I thought would be SIMPLE, but can't get it to work. I have a 9205 card in a little 9174 cDAQ USB chassis. My *intended* behavior is to wait (block) at the DAQmx Trigger/Start Analog Edge on, say channel ai1, until I get a falling edge thru, say, -0.050V. So I have a little vi (that contains 2 parallel loops) that I want to sit & wait for the trigger to be satisifed. I'm doing "routine" voltage measurements in another AI loop on a different channel. I want this vi to run separately from my "routine" voltage measurements because I want the app to respond "instantly" to input voltage exceeding a limit to prevent expensive damage to load cells. I was afraid that if I used either Finite or Continuous sampling to "catch" an excessive voltage, I might miss it while I'm doing something else. Yes, yes, a cRIO real-time setup would be better for this, but this is a very cost-sensitive task... I just want to "Arm & Forget" this process until it gets triggered, whereupon it fires an event at me. SO... I'm also reading the same voltage on channel ai0 for regular-ole voltage measurements, and just jumpering them together. I did this because I read somewhere that you can't use the same channel for multiple DAQ tasks - I *thought* I would need to set up the tasks differently. {but now that think about it, the setups can be the same...}. I've set up the DAQmx task the same as shipping examples and lots of posts I've seen. I'm supplying a nice clean DC voltage to a 9205 card using a high quality HP variable power supply. Using NI-MAX, I've verified that my 9174 chassis & 9205 are working properly. THE PROBLEM - When I run it, the vi just sails right through to the end, with no error, and an empty data array out. No matter WHAT crazy voltage I give the "DAQmx Trigger.vi" (set up for Start Analog Edge), it never waits for the trigger to be satisfied, just breezes on through as if it weren't there. If I set the Sample Clock for "Finite Samples", the DAQmx Read fails with timeout - makes sense, since the trigger wasn't satisfied. What could I possibly be doing wrong with such a simple task??????? So my fundamental misunderstanding still vexes me - does the DAQmx Trigger vi not block and wait for the trigger condition to be satisfied, like the instructions state - "Configures the task to start acquiring or generating samples when an analog signal crosses the level you specify"? I stripped my requirement down to the bare essentials - see the 1st snippet, the 2nd is my actual vi. Any ideas, anybody?
-
Can anyone please tell what a DVR [ Data value reference ] is ? I want to know at what situation it will be used and what are the advantages we get by using DVR. I am really confused in this topic . If someone has any code in which they have worked with DVRs. kindly share it to me. Thank you.
-
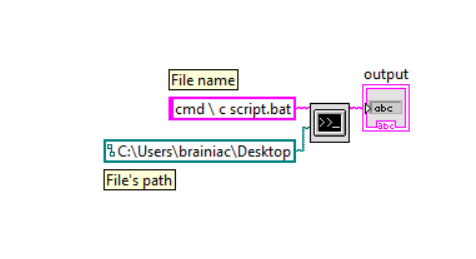
Hi everyone, It's all said in the title. I wanna run a .bat file with Labview, i have used the system exec Vi but it didn't work. However when i run the script directly, it works. Can u help me with this issue Attached, my code thanks in advance
-
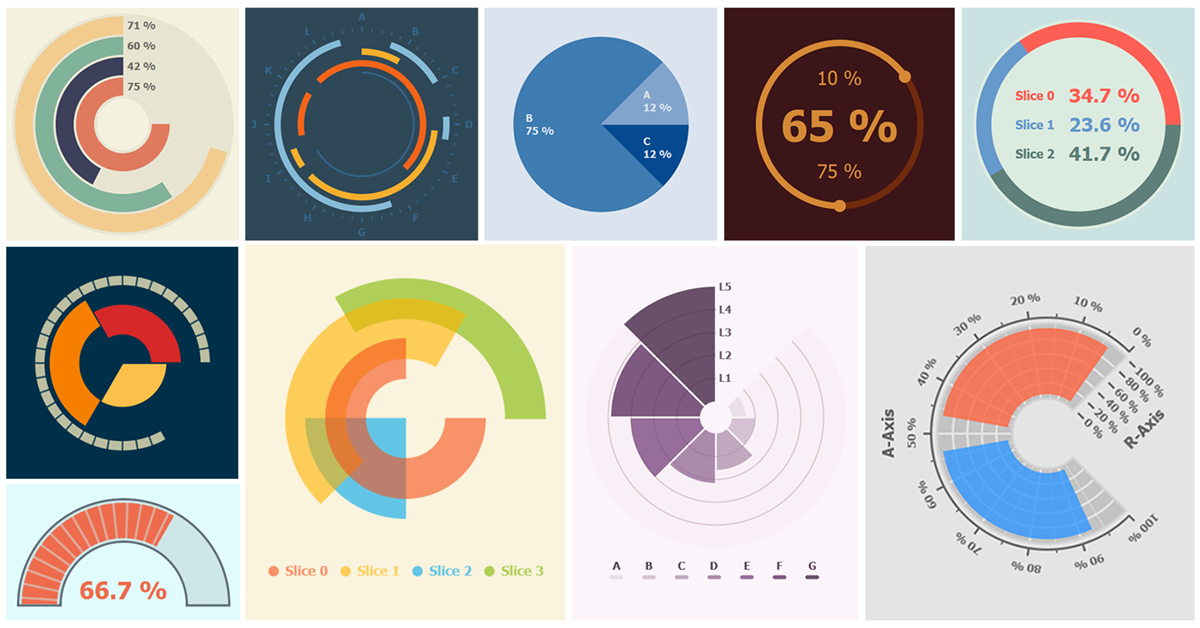
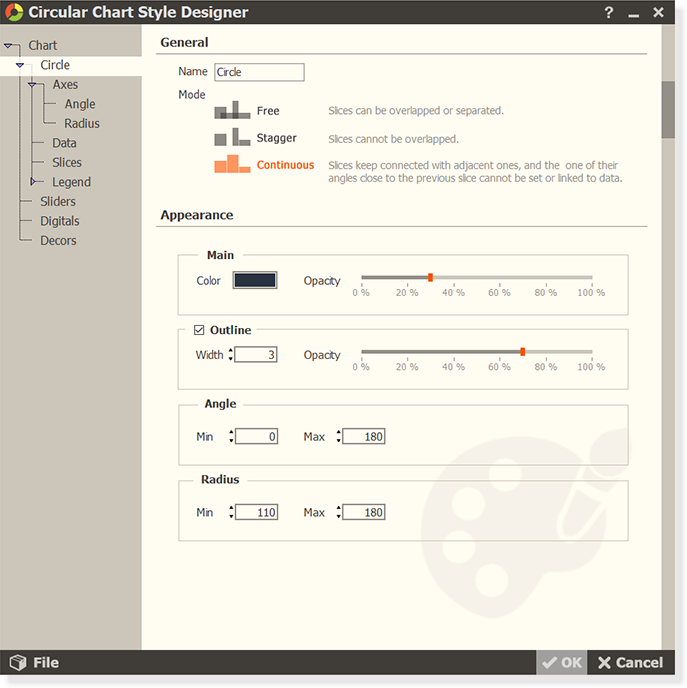
Circular Chart Base A flexible and easy way to create high quality circular charts with features such as anti-aliased and translucence, helps you to deal with the boring and time-consuming drawing details. http://sine.ni.com/nips/cds/view/p/lang/en/nid/217432 Features Chart Types : Supports multiple types of charts, e.g. , pie chart, doughnut chart, polar area chart, circular bar chart, circular slide, graduated gauge chart. Chart Elements : Multiple types of chart elements can be added to the chart, e.g. , legend, scale, grid, slider, digital, decoration. Slice Modes : Three modes for different overlapping and connecting relationships between slices. Customizable : Most properties of chart objects are customizable. Reusing & Sharing : Charts can export images for reporting, and their styles can also be saved as files for reusing and sharing. Quick-Start : Easy to use, and you can quick-start your development based on several build-in styles. How to Use Single Control : The Circular Chart Add-On is ultimately defined as a single control. Chart Styles : Being edited or loaded with different styles, the chart can be presented in the different types listed above, or even more. Style Designer : The chart style is configured by the Chart Style Designer dialog box, which can be displayed through the right-click menu of the chart, similar to the Properties dialog box of the LabVIEW controls. Auto Reload : After configured, the style can be saved into the chart instance in your VI and automatically reloaded the next time. Data Type : The data type of the chart is 2-D array of SGL numeric. Each row of the array corresponds to a slice in turn, and each column corresponds to a slice parameter you specify in the Chart Style Designer, the available slice parameters include start angle, end angle, inner radius, and outer radius. http://sine.ni.com/nips/cds/view/p/lang/en/nid/217432 http://kitx.mystrikingly.com/
-
Join us at NIWeek 2019! Contributors of labviewwiki.org, (including future contributors), can add to their ribbon collection by finding an admin during NIWeek or at the LAVA BBQ! See you there!
-
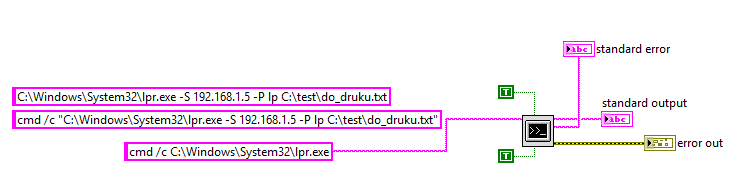
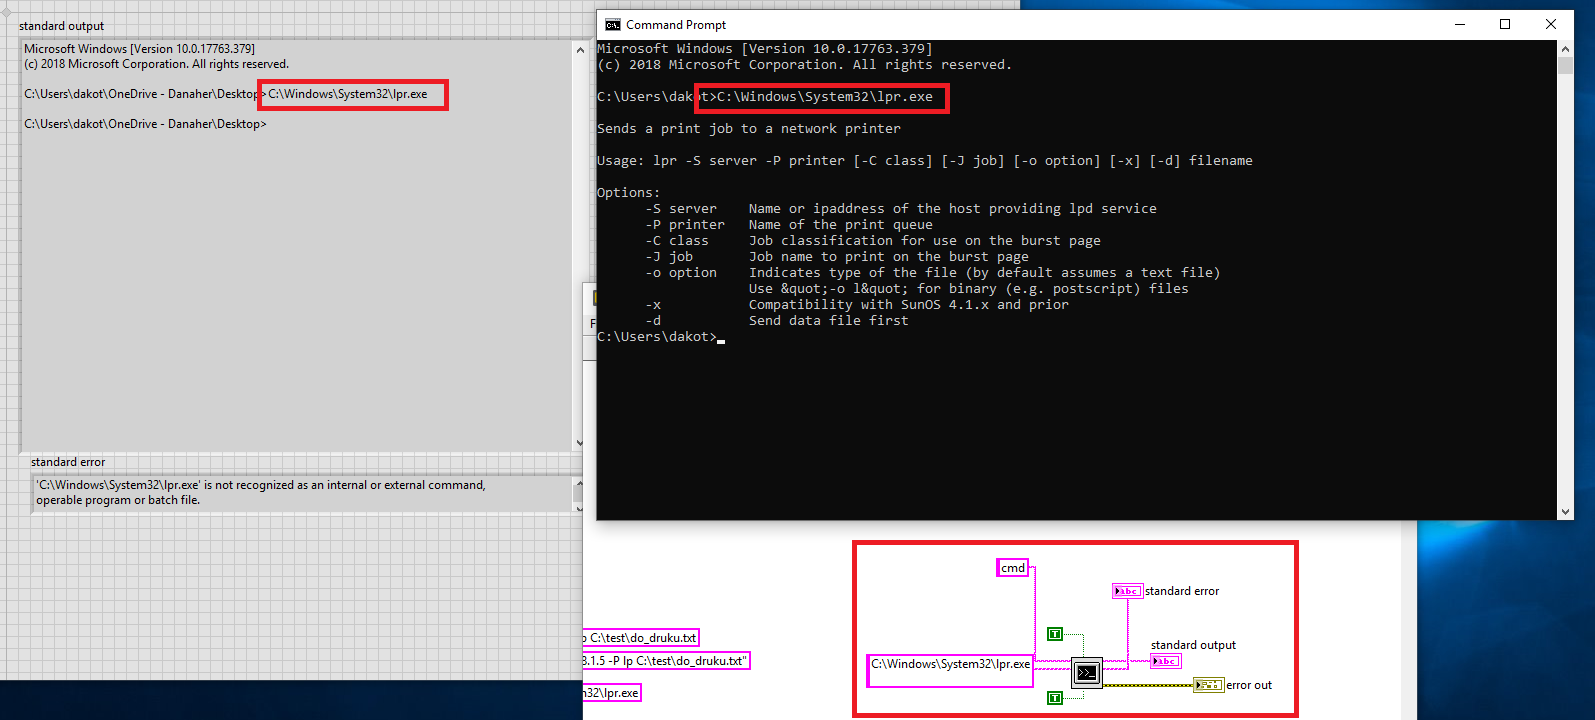
 I'm trying to execute LPR.exe command to print some labels on a printer. However as its normal, problems occur. I could not find answer on any topic conneced with "sytem exec". I already tried all described methods (I think so). That's why I'm asking very kindly for any help. When trying to execute or call the LPR.exe from System exec VI, I'm receiving error: "'C:\Windows\System32\lpr.exe' is not recognized as an internal or external command, operable program or batch file." Generally I would like to call function: "lpr -S 192.168.1.5 -P lp C:\test\do_druku.txt" which works from command window without any problem. print.vi
-
15. FIFTEEN. That's the number of current job postings in my group. We're hiring! This is the most fulfilling, challenging, and rewarding position I've held. Job specific requirements listed on the website. https://www.lockheedmartinjobs.com/search-jobs/Test%20Engineer/Grand%20Prairie%2C%20TX/694/1/4/6252001-4736286-4684904-4694482/32x74596/-96x99778/15/2
-
My project involves designing a front end for a synchronous generator using LabVIEW. It is actually data acquisition and display of signals in a file. The problem I face when building a program is that: 1)the sampling rate is set to 100 samples with 1 kHz sampling frequency.These signals are generated by daq assistant and i have used merge signals to merge these signals from daq assistant as well as signals from other radio buttons and Boolean as well. The problem is that when written on a file I am able to see only one instance of Boolean status for every 100 samples daq assistant creates. 2) now iam able to write only 0/1 as status of Boolean in the file.How will I write on /off into file?
-
With exciting projects in oil and gas, aerospace, utilities, and other industries, Vertical AIT is looking to hire skilled LabVIEW developers and architects in the Houston area. We are an Alliance Partner, and we specialize in embedded development. Requirements: - US citizenship (required by our contracts) - Industry experience in production software development - Embedded cRIO development experience (Real-time and FPGA) - Certification (CLD, CLA, and/or CLED) preferred - Must be meticulous and detail-oriented We offer great benefits, and we prioritize a healthy work/life balance. Learn more about Vertical AIT at www.VerticalAIT.com, and please send resumes to jobs@verticalait.com.
-
 Hello, I'm trying to send data from my RPI b+ to labview and store the information in a spreadsheet, right now the data I'm using is just a sawtooth generated in the python code but eventually it will be sensor data adquired via spi, the data comes at =~ 6-7khz but the time it takes to send the data to labview is much greater, I fear the circular buffer I intended to use to store the data before sending it via tcp will get filled pretty fast. I'm not very experienced in either python nor Labview, I was wondering if i could get some advice in the optimization of the code. I attached the VI of the client and a VI that graphs the data on the spreadsheet, also the python code. Thanks in advance, sorry for the mess. Waveform Grapher.vi Client.vi serverSerial.py
-
 hello there i'm stuck with my assignment. i have made a VI that generates random number and writes the data to CSV file I have added a timer stamp in the first column now i want to get the data for every 5 seconds using wait function how do i do it ? Thanks in advance 2d array random no v2.vi