-
Posts
591 -
Joined
-
Last visited
-
Days Won
26
Content Type
Profiles
Forums
Downloads
Gallery
Everything posted by ensegre
-
An animated gif is of course a convenient compact container, I was thinking too, but a suitable custom format could be devised to the same extent, if one really decides to pursue this path. For instance, a zip containing the pngs and playlist information, or timing encoded into the png filenames. I also remarked that some animated gifs contain incremental (like e.g the one in Steen's), not full frames (like in bbean's above), but I guess that could be appropriately taken care of too, at worst converting them to full independent frames. A matter of effort for the purpose. What I wonder is if it is worth to concoct some kind of Xcontrol out of the idea, in order to get a configurable animated button, hiding the additional event loop.
-
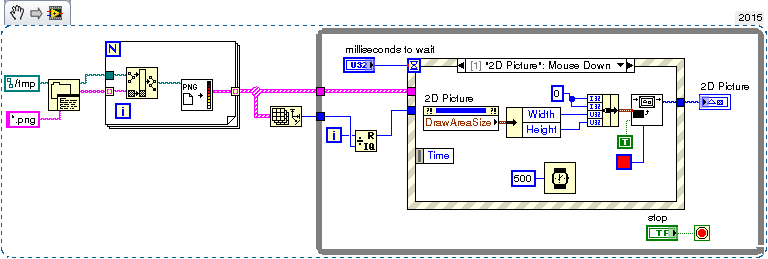
Maybe I say an heresy, but what's wrong with a clickable picture box? This is a q&d attempt, just loads in memory all *.png found in a directory and animates them, it doesn't look to me as overcomplicate as an embedded activeX browser or the like. Maybe a portable Xcontrol out of it? RotatePNG.vi
-
If some of your "dimensions" are just A vs. B (e.g. 50 vs. 220, Al vs. Ti like in what you show), perhaps plotting each group in a different panel and juxtaposing them may convey better the information than a single plot with too many similar looking symbols. Indeed the symbol variety in LV plots is nothing impressing. Other plotting packages have many more options as for shapes (e.g clubs, diamonds, ducks, broccoli), hatchings, and whatnot. One additional style parameter which you could use to differentiate sets on the same plot in LV, could be symbol size (Line Width). Of course useful only where you have two or three possible classes, not for a continuous range.
-
I'm also onboard about not having to check and branch for an invalid default input, but an use case where that would really have been a hindrance never really occurred to me. Putting aside for a moment the considerations about use case ("would a polymorphic implementation be leaner?"), it seems to me the problem splits into two different parts. This is how I would envision using them, but I don't really know what is going on under the hood to understand if it they make compiler-wise sense. a) a scripting Property node like say VIserver/Generic/ConnectorPane/IsTerminalWired[], returning an array of booleans b) a new special Case/Conditional Disable hybrid, allowing a control terminal (unlike the Disable) connectable to these booleans, but imposing the elimination of dead code (unlike the Case). Now, a)'s results would be determined at compile time, looking up at the calling context, and perused by the programmed code. I suppose the wire could be as well probed for debugging, and if the VI is used multiple times, called by ref or whatnot, the result would reflect the called instance / clone being run and probed. It's b) that looks to me quite awkward. ("a new special frame, seriously? accepting only compile-time determined boolean inputs? Are boolean operations on compile-time booleans permitted?"). a) would just tell about terminals and b) would make explicit (?) the optimization, but?
-
Unless you are in a situation where you can happily mix commands and replies, because each instrument identifies itself in the reply, and the response to a query may take a variable time, or parallelization would be advantageous, and the bus has some arbitration feature that prevents instruments from talking simultaneousy. Then you should create a readout queue, identify and dispatch messages received there, etc. It never occurred to me so far to do it, but that makes sense.
-
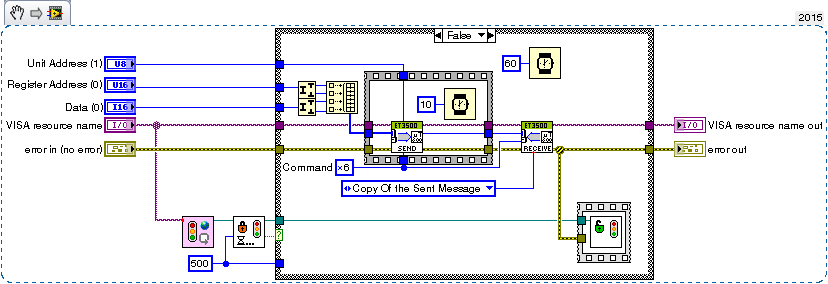
I don't know. But for a similar case, in my ignorance and probably just crudely redoing what the lock is supposed to be for, I used semaphores named after the VISA resources. I acquire the semaphore immediately before every read or write, and release it then (forget the specific details of the readout): To deal with multiple serial ports I have a FGV containing the list of serial ports used and their associated semaphore references. ResourceSemaphoreContainer.vi
-
Might it be that some file in <LV>/resource/PropertyPages/ is screwed up/not readable? This was earlier in the forum, and explains to some extent: http://webspace.webring.com/people/og/gtoolbox/CustomizePropertyPages.html
-
Years ago I had a similar problem, and I think I temporarily resolved it by disabling/reenabling the device, which is not exactly the same as reinstalling as you ask, though. Here are some links I perused at the time (the last dead now), which involve a command called devcon, which worked for XP. Maybe it helps... http://en.kioskea.net/faq/1886-enable-disable-a-device-from-the-command-line http://www.rarst.net/script/devcon/ http://www.wlanbook.com/enable-disable-wireless-card-command-line/ http://www.osronline.com/ddkx/ddtools/devcon_86er.htm Otherwise I can just generically recommend to make your usb connection as robust as you can, to improve reliability. Watch out for flimsy cables, and EMI.
-

MOV to AVI or intensity array?
ensegre replied to Bill Gilbert's topic in Machine Vision and Imaging
On linux, avconv is powerful, command line, and options rich. I have used it routinely to create .mov from .wmv, for instance. For automatic conversion, I imagine one could set up a script which checks for new files in a given folder and initiates conversion after they have stopped growing since longer than N seconds, or something the like. It never occurred to me to stream contents through some pipe for conversion on the fly, but that might be possible too. If windows is required, short of seeing if something can be run in MinGW/Cygwin, I see that libav provides windows builds, but I haven't looked into operation.- 14 replies
-
- conversion
- video
-
(and 2 more)
Tagged with:
-
(probably echoes what also said in the other thread): If the reference can become invalid in the course of the iterations, and I want to check it specifically at each iteration, I'd put a shift register; if it is sufficient to know what was the initial ref, I'll go for 1. or 3. If reference going invalid in the course of the execution of the inner VI implies an error at output, I'd put a shift register on the error wire. But most importantly: if there is any chance that the loop executes 0 times, use 2., not 1.
-

Adding values in a continuously changing arrray
ensegre replied to Niranjhani's topic in LabVIEW General
https://en.wikipedia.org/wiki/Lakh -
Thread starving might become an issue eventually, but only if there are some thread-locking calls, e.g. orange CLFN. But anyway, I would give some thought about whether the proposed architecture is really sound and couldn't be factored out differently. For example, would it scale gracefully if a fourth, a fifth instrument and so on will need to be added later on? In the middle level, why a cluster of queue references needs to live on the shift register? How does the producer loop address the right queue, and how easy would it be to add more commands/instruments? What would be the stop conditions of the inner and outer while? Is it ok that the each "measurement" command produced by the top level translates to independently executed instrument commands, or is there some sequentiality and interdependence to be accounted for?
-
86 means labview 8.6? At that time IIRC IMAQdx was provided as an unsupported addon rather than as a device driver component, so location and probably naming of vaguely equivalent VIs may have changed. "IMAQ USB Init.VI" may be roughly "IMAQdx Open Camera.VI", for one. It may be that you can still download the package from NI Support, but if you have LV2014, the sane thing would be to use IMAQdx coming with it.
-
Are you sure it is not diaphony of your sound card? Does it happen with other sound generators as well on the same system?
-
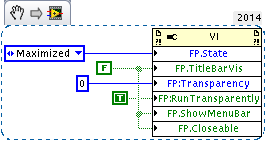
I was considering that the normal OS behaviour, for clicks outside a window in foreground, in a windowed OS, is to bring to foreground another application. In such case LV keeps running as a background application, having no notion of concurrent processes and composting of windows assigned to them by the OS. So no wonder that LV itself has no notion of "my window is not anymore in foreground", but only, at best, of "Is the front panel of this VI the frontmost among all LV windows". So trapping of external mouse clicks might be possible only through OS calls, polling the focus assigned to application windows by the OS. What is the UI effect sought, though? If it is preventing or trapping outside clicks, what about workarounds like a) make the said FP modal, b) create a dummy transparent VI (not available in linux, I fear) with a FP devoid of any toolbar and scrollbar, which fills the screen for the sole purpose of trapping clicks?
-
Again, refer to the examples above, just give the same color to each ActivePlot. A strategy could be not to delete plots, just to replace data with NaN to keep the number of plots constant. Another may be to set the Plot.Visible? property to false individually for the plots to be hidden, but having to do that in a loop may be slow too. Try.
-
Enforcing the plot color as was already shown above, and commented as being somewhat slow. To the point that a better strategy could be not to change the colors but to cycle the data.
-
If python-like indexing is implied, the OP is probably wrong. $ python Python 2.7.6 (default, Jun 22 2015, 17:58:13) [GCC 4.8.2] on linux2 Type "help", "copyright", "credits" or "license" for more information. >>> a=[7,6,5,4,3,2,1] >>> a[2:] [5, 4, 3, 2, 1] >>> a[:3] [7, 6, 5] >>> a[-1] 1 >>> a[4] 3 >>> a[-4:-2] [4, 3] https://docs.python.org/3/tutorial/introduction.html#lists https://docs.python.org/3/tutorial/introduction.html#strings
-
Not exactly. Sensor pixels are usually just a few um wide; different sensors have different sizes. The demagnification of your lens has to be such that it projects a detail of 800um length over 2 or 4 or so many sensor pixels. In my view, simplifying, if the optic system is fine enough, and you have say a white pixel followed by a black pixel, and the centers of the pixels image two points which are 800um apart, you have enough basis to say that the edge falls inbetween. If you have a white, a grey and a black pixel, you'll say that the edge falls somewhere close to the center of the second pixel. The whiter that, the farther close to the third. To be rigorous you should normalize the image and have a proper mathematical model for the amount of light collected by a pixel; to be sketchy let's say that if x1, x2, x3 are the coordinates of the image projected on the three pixels, and 0<y<1 is the intensity of the second pixel, the edge is presumed to lie at x1+(x2-x1)/2+(x3-x2)*y. This is subpixel interpolation. (a common way this is mathematically done, for point features, is computing the correlation between the image and a template pattern, fitting the center of the correlation peak with a gaussian or a paraboloid, and deriving the subpixel center coordinates by parametrical fit) Then you have to move either the product or the camera perpendicularly to the optical axis, which I presume you'd want perpendicular to the focal plane. But, if you put together an optical system which is able to have in view ~19" in one dimension, why should you need to move at all, to see 20" in the other? Look the net for "Motorized zoom lenses", "zoom camera", or the like. Here are a few links but absolutely no experience, nor endorsement. http://www.theimagingsource.com/products/zoom-cameras/gige-monochrome/dmkz30gp031/ http://www.tokina.co.jp/en/security/cctv-lenses/standard-motorized-zoom-lens/ https://www.tamron.co.jp/en/data/cctv/m_index.html otherwise I would have said, just rig out a pulley connected to a stepper motor, actioning the manual lens focus... Before getting into that, I'd say: choose first a camera using a sensor with the resolution and speed and quality you desire. Once you know the sensor size, look (or ask a representative) for a suitable lens, with enough resolution power, and the capability of imaging 20" at the working distance you choose. Once you have alternatives there, check if by chance you're able already to work at fixed focus with a closed enough iris (https://en.wikipedia.org/wiki/Circle_of_confusion).
-

Improved performance with additional tunnels?
ensegre replied to Rüdiger's topic in Application Design & Architecture
Obscure compiler optimizations I would guess. Possibly platform dependent, maybe related to the fact that you create buffers for the empty arrays at the unconnected exit tunnels. Hint: show buffer allocations, I note that for example a buffer is shown as created twice on the output logic array for case 0, and once for case 1. For the limited value that this kind of benchmarking has on a non-RTOS, I get slightly different timings, with a minor decrease between 0 and 1 rather that between 1 and 2: 0 23.96-0.35 24.04-0.20 24-0.29 1 23.6-0.58 2 25.56-0.58 25.52-0.51 3 33.32-0.69 I also remark that timings change slightly if I remove case 3: 0 23.88-0.38 1 23.69-0.49 2 24.41-0.51 and further decrease if I delete the clock wire inside each case connecting to the unused input tunnel of the outermost loop. -
my bet is that you could even tuck along with less than 2px/800um, if I understand your problem. I presume 800um lateral resolution, not vertical. I'd say with any decent lens for sure - provided the camera is properly centered on the object, the object is plane, the focal surface of the lens is plane, the lens is well focused, etc. Do you need to keep in focus different PCBs/different cut out recesses at different levels at the same time? If so it is more a question of depth of focus than of FOV. Otherwise adjustable focus may be simpler to motorize than vertical translation. With a telecentric lens you'd also keep the same magnification at any depth, is that as important to you?
-
20*25.4/0.8=635. How do you get to 11000? Let's say you allow for some PSF blur and you overresolve your details x4 (which is already much). You'd be then in the range of a 5Mp sensor, nothing special these days. If your illumination conditions and sensor noise are good, you may even able to rely on subpixel interpolation, and get along with a smaller resolution. Normally the working distance is mainly dictated by the space available, based on that and on the sensor size you chose a lens with a suitable focal distance and resolution power. If you are designing the system and have some freedom on the working distance, go for a good lens first and use the resulting distance. Are your objects more than a cm deep? Then I subscribe to telecentric. I don't have rules of thumb, but I would say very tentatively that more than say 5% depth/working distance requires either a large f stop or telecentric. Translation stages add a mechanical complication. Whereas, you can achieve a reasonably precise measurement with deforming optics and fixed point of view, if you calibrate it geometrically.
-
It is certainly a viable idea, but only for those cases where cell sizes and font properties don't need to be customized on cell basis, which is not possible with array elements. Also, thick borders may be somewhat intrusive. The LV table is lousy, but still a notch more customizable over arrays... Been there, done that... (with some of the optimizations mentioned above)
- 7 replies
-
- property node
- optimize
-
(and 1 more)
Tagged with:
-
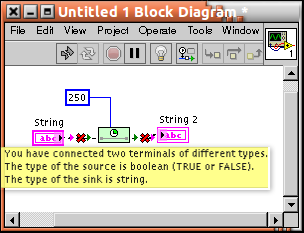
Right, on second attempt it is working . (I was always choosing from palette, wasn't I?) So did I mistype ExternalNodesEnabled on the first? QD also seems ok. Thx! I guess I can't ask about wire adaptation rules, nor "You linked something to me! Here its help stuff instead of my usual dummy text and link...enjoy!", but I'd have to figure them out, otherwise where's the fun.
-
And are they supposed to work as such there? Perhaps only with an appropriate key? (I have tried ExternalNodesEnabled=True and XnodeWizardMode=True at no avail). I remarked since many versions the presence in palette of /usr/local/natinst/LabVIEW-2011/user.lib/macros/ExponentialAverage.vim /usr/local/natinst/LabVIEW-2011/user.lib/macros/IncrementArrayElement.vim /usr/local/natinst/LabVIEW-2011/user.lib/macros/IsArrayEmpty.vim /usr/local/natinst/LabVIEW-2011/user.lib/macros/IsValueChanged.vim but never understood what those type limited, odd leftover-like .vi(m!) were dropped there for. In fact, I even happened to grab and modify IsValueChanged.vi, changing its input to variant "for more generality", for perusal in my code. And, as for https://decibel.ni.com/content/docs/DOC-43686 Or am I missing something?


