ensegre
-
Posts
596 -
Joined
-
Last visited
-
Days Won
26
Content Type
Profiles
Forums
Downloads
Gallery
Everything posted by ensegre
-
 Also (I'm on linux, desktop), Crash logger.vi is broken because of a missing /<vilib>/nisysconfig/Close.vi and Close (System).vi (This VI needs a driver or toolkit component that is not found. Missing resource file "nisysapi.rc). And, perhaps as a consequence, the "System Session" nodes miss any of the properties they're supposeed to have. Was the code really tested on linux? [maybe on some RT NI-linux, which I miss?]
 -
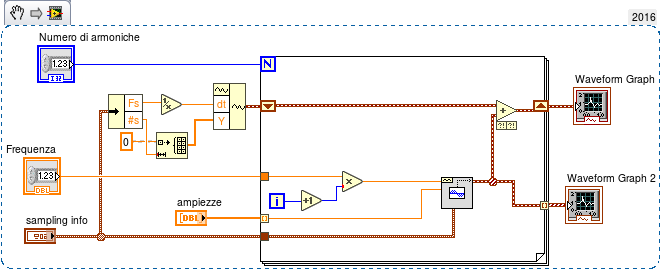
Plotting sum of sine harmonics with labview using for cycle
ensegre replied to paolatavernise's topic in LabVIEW General
Prova così... le ampiezze e fasi giuste ce le devi mettere tu.
-
Automatically Adding Build Date To Front Panel
ensegre replied to Taylorh140's topic in LabVIEW General
A potential caveat: I've used this pattern in the past to generate a VI with a default string value containing build date and git version, and included it in the project I was building. Only, when I tried to use it as a prebuild action, most of the time I got spectacular LV crashes, recoverable only by clearing the compiled object cache. I presume that something becomes stale there if the VI is marked as unmodified but in fact it is during the build. I gave up tracking down the issue, just resolved to run my tag-generating VI just before build manually, with the project closed. That was in LV2014 and 2015 at the time. I saved some logs; the cryptic errors I used to get were of this sort: Error 1124 occurred at ... Possible reason(s): LabVIEW: VI is not loadable. (a perfectly loadable and unrelated VI) DAbort 0x1A7102DF in fpsane.cpp ... Someother.vi (another sane and unrelated VI) The build was unsuccessful. Possible reasons An error occurred while building the application. Either you do not have the correct permissions to create the application at the specified location or the application is in use. Invoke Node in AB_EXE.lvclass:Build.vi->AB_Engine_Build.vi->AB_Build_Invoke.vi->AB_Build_Invoke.vi.ProxyCaller <APPEND> Method Name: <b>Build:Application</b> Details Click the link below to visit the Application Builder support page. >Use the following information as a reference: Error 8 occurred at AB_EXE.lvclass:Build.vi -> AB_Engine_Build.vi Possible reason(s): LabVIEW: File permission error. You do not have the correct permissions for the file. \=========================\ NI-488: DMA hardware error detected. (NI-488 DMA? WTH?) Error 1 occurred at EndUpdateResourceA.vi Possible reason(s): LabVIEW: An input parameter is invalid. For example if the input is a path, the path might contain a character not allowed by the OS such as ? or @. \=========================\ NI-488: Command requires GPIB Controller to be Controller-In-Charge. -
If you do images, or call something inside a DLL, nothing would be too insane. But I guess you already did your homework in trying to track that down. What look strange are the saturation at 3 GB and then the sudden drops and recovers. Makes me suspect of a corner problematic case of LV's garbage collector... I don't know if it helps, your post reminded me of this old discussion. There I hijacked the thread to complain about what definitely turned out to be a bug of LV webserver, which appeared in one LV version and was silently covered up a couple of versions afterwards. That thread goes a bit on on the tone "trimming has nothing to do with a bug", "yes there is a bug", but essentially is about a call to the windows API to trim the process working set, which might be of some use to your testing.
-
reading LCD characters(16X2)
ensegre replied to Nishar Federer's topic in Machine Vision and Imaging
Will the smart cam run OCR onboard? If that is not required, a properly placed webcam and a couple of leds might just do, for much less. As Tim_S wrote, the art is setting things up for getting always a clean image. The OP doesn't say if his next question would be then how to use IMAQ, image preprocessing, OCR and all what involved. -
It occurs to me that maybe only NI-SCOPE cards have real trigger inputs. But for normal DAQ cards, you could use some scheme in which, even with software start, you first start the acquisition on the event channel and on a fiducial channel, then you output the control signal which is also routed to the fiduciary input. Since relative timing of the sampled data is deterministic (channels are either simultaneously sampled in high end cards, round-robin in lower), analysis of the two sampled signals should give you the answer.
-
Why not just using your DO signal as trigger for starting the DI acquisition? Subsequent analysis of the acquired waveform would measure the time of what you define as event, isn't it? 1ms and the desired DI time resolution alone dictate the required sampling rate, but nowadays even the entry DAQs are capable of ksps.
-
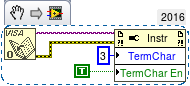
Please help! I want to split the number from this format string
ensegre replied to lovemachinez's topic in LabVIEW General
Guessing that this stream comes from a VISA read, you'll probably want this:
-
didn't know it.
-
isn't exporting from LV to file to be read within html, enough of a performance hit?
-
I don't have direct experience with it, but I guess that if all you are into is to pass image data and display, that would be practicable, but if your aim to interface even only a subset of opencv directly with LV, that would be quite a different story. The hardness of the task has been mentioned in the past, e.g.
-
I gave some serious thought to the picture control, which is still LV and probably UI thread and cpu demanding. I didn't really went that far, but at least sort of implemented zoom and pixel value indicator, and taxing cpu I get in the 30fps range. Not even nearly as nice as the imaq display, but at least an alternative. It's in my https://lavag.org/files/file/232-lvvideo4linux/
-
just tried on my laptop to confirm: sudo ./INSTALL <--nodeps> works for 2016 64b and 32b, and for NIVISA1600L. However visaconf, etc, as well as LV VIs rererencing VISA coredump even after updateNIDrivers and reboot. Excellent opportunity to confirm that also sudo NIVISA1600L/UNINSTALL works.
-
I'd rather say, instead, that my pain experiences were with older versions and RH based distros like CentOS. There I remember having to fiddle with the C of some sources, guessing from parallel reports on the ni site, and yes, hardlinking the right MESA (it's an OpenGL emulation library) or something the like. As a reminder to myself, former noise of mine on the dark side, Re: nikal on 2.6.17 kernel, Re: NIDAQmx on Fedora Core 5 How-To. With newer versions it got less and less painful; if anything, barely little more than aliening the rpms. Of course as long as you're not serious about hardware support.
-
I have LV12, 13, 14, 15 on my desktop (probably ubuntu 12 release upgraded to 14) and 14, 15, 16 on my laptop (ubuntu 14 upgraded to 16). So possible it is possible. How do I do, I forget year after year, immediately after I succeed. IIRC it usually involves an "Oh, ./INSTALL.sh gives an obscure ]] not expected syntax error", and an "ok, let's copy all the *.rpm to /tmp and alien -i them". On those two systems I can confirm the installations survive to distribution upgrades, the files just sit in /usr/local/natinst/. I usually never bother to get VISA really working, I only use the installations for code-checking and algo developement, GUI without being too picky about font look (which however somewhat improved with 2016). If I'd be to bother about VISA, I think I always stumbled in noncompilable kernel modules. Maybe the last time I somehow succeeded in having VISA working on a nonsupported distro was in 2008.
-
Change resolution image snaped by gigE camera
ensegre replied to ASalcedo's topic in LabVIEW General
You are the master of your code, you can do what you want. Perhaps you're asking - if I get a full image from my camera, can I extract a ROI with IMAQ - short answer, yes, http://zone.ni.com/reference/en-XX/help/370281P-01/imaqvision/region_of_interest_pal/. But you may also want to look into getting only a ROI from the camera, to reduce the payload. To do that, you send settings to the camera, and get only that part of the image; you can't expect to draw something on a LV widget and magically have the camera know about it. Unless you code for that. I think you are confusing the IMAQ image buffer size with the actual content acquired by the camera and transferred to the computer. IIRC the IMAQ images auto-adapt themselves in size if they are wired to receive image data different than the sizes they are set to. Of course you can also get your images at high resolution and resample them, but that adds processing time. You may have to grasp how IMAQ images are handled btw - normally transformation are never in place, they require the preallocation of a source and of a destination buffer. -
Change resolution image snaped by gigE camera
ensegre replied to ASalcedo's topic in LabVIEW General
The application has to render a larger number of scaled pixels onscreen. The performance drop may be particularly noticeable on computers with weaker graphic cards (e.g. motherboards with integrated graphic chipsets) which defer part of the rendering computations to cpu. If you process smaller images, your processing time may also be proportionally smaller. Additionally, image transfer and memcopy times will be smaller. But images at lower resolution contain less information. You are the one who has to decide how small the resolution can be, in order to still derive meaningful results from the analysis. If the bottleneck is rendering, you could constrain the GUI so that the display never gets too wide, or the zoom factor never too high. Another popular approach is to process every image from the camera, but to display only one image every so many. Depends on the camera. Look for image size, ROI (AOI), binning. If you can with MAX, you can with LV (GigE, almost surely Genicam -> IMAQdx properties). [with the advantage that in MAX you can save the default setting]. If you can't with MAX/LV, it might be that a camera SDK allows control of additional features, check your camera documentation. -
Cannot pass argument to dynamic re-entrant VI
ensegre replied to RayR's topic in Application Design & Architecture
Could you trim that down to some code without hardware dependence, which we can look at? Oh, and you mentioned dynamic events. Are they involved here, so that you have reasons to blame them? -
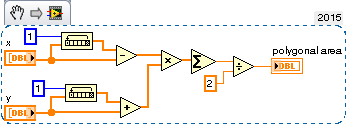
Area within a curve - Green / Kelvin-Stokes Theorem
ensegre replied to gyc's topic in LabVIEW General
Doh, completely right. That would be the first of the alternatives given in https://en.wikipedia.org/wiki/Shoelace_formula, plus argument checks. It occurred me to think that among the various alternatives, both the one I thought and this one are the most efficient needing only two array allocations and one multiplication. The determinant form in http://mathworld.wolfram.com/PolygonArea.html needs two. -
Cannot pass argument to dynamic re-entrant VI
ensegre replied to RayR's topic in Application Design & Architecture
just to exclude the obvious: how do you know? Are you inspecting the right instance of the clone? -
Area within a curve - Green / Kelvin-Stokes Theorem
ensegre replied to gyc's topic in LabVIEW General
No. https://en.wikipedia.org/wiki/Shoelace_formula, http://mathworld.wolfram.com/PolygonArea.html. Just with an alternative arrangement of the terms. You could if you want to rasterize your image. Do you need that? -
Area within a curve - Green / Kelvin-Stokes Theorem
ensegre replied to gyc's topic in LabVIEW General
Why arguing? If you have the coordinates you have the analytical solution. You may decompose it in summation of areas of oriented triangles with a common vertex (any point of the plane), or in trapezes based on the y axis, you will get to the same result.
-
See http://forums.ni.com/t5/Example-Program-Drafts/Create-Configuration-Files-INI-for-Your-LabVIEW-VIs/ta-p/3536260
-
You have to code it yourself in a way or the other. For example having your VI save the important values in some kind of config file on exit, and read them in (if the file is present) first thing on start. Your choice whether to dump plainly the control values in a binary file (inflexible and obfuscated), to use a standard format like xml or json, or a plain format of your design for human readability, and how to treat file errors and make room for future changes. OpenG should have something in this direction, never used. Another way may be invoking "Make current values default" and then saving the VI, programmatically. I find the first solution preferable in general.
-
Fit objects in tab control in a lower screen resolution
ensegre replied to ASalcedo's topic in User Interface
There are properties like VI server/Application/Display/Primary Workspace, VI server/VI/VI/Front Panel window/window bounds which you can use as a base for your computed placements.