jacobson
-
Posts
161 -
Joined
-
Last visited
-
Days Won
10
Content Type
Profiles
Forums
Downloads
Gallery
Everything posted by jacobson
-

Quickly create local variable from property node or vice versa
jacobson replied to Casey's topic in LabVIEW General
You could just gut out the main scripting code and put it into something like the Scripting Springboard NormK has posted. Instead of a right click you select the property nodes or local variables and click a floating button that will execute the scripting routine on those objects. https://forums.ni.com/t5/LabVIEW-APIs-Blog/Automating-LabVIEW-Development-with-the-Scripting-Springboard/ba-p/3475829 -
I'm not sure if it was ever really tested to run on RT but from what I found, it doesn't seem like the Test Event Global function ever returns True from the First Call? primitive so it never actually spawns the process in the first place (once you connect to the RT target it reserves the VI for execution so maybe this has something to do with it?). I was interested in running this on RT as well so let me know if you get that part working. Once you get that part working I still think that you would need to change "VI Name.vi" to ignore any errors generated internally. In my case, the VI throws error 53 at the property node which results in the test never being registered although I think we would be safe to ignore the error as we are just getting the VI name from the call chain in that case. Just remember to not also clear any errors coming into the VI itself.
-
Were the old NIWeek videos moved to another location? I could only find the 2018 videos on the LabVIEW_Videos login and thought there used to be previous NIWeek and CLA Summit presentations on that login.
-
Where to start when LabVIEW Crash Reporter is displayed
jacobson replied to takanoha's topic in LabVIEW General
Not sure to be honest. All of the NI symbols are not handled by me so I just point to some symbol server. -
Where to start when LabVIEW Crash Reporter is displayed
jacobson replied to takanoha's topic in LabVIEW General
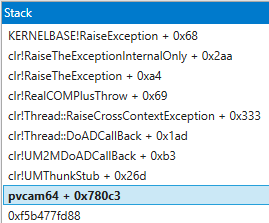
Hard to say too much but even without any NI symbols, I get the following call stack which, to my untrained eye, seems to indicate that the camera driver you are using is calling causes some clr exception. I don't have any symbols for the pvcam64 driver so I don't know what call is being made.
-
Where to start when LabVIEW Crash Reporter is displayed
jacobson replied to takanoha's topic in LabVIEW General
I usually don't recommend using the first token unless you are trying to capture a specific crash. Full crash dumps can be very large and not only will crashes generate full dumps but all DWarns will create full memory dumps so the LVInternalReports folder will get pretty enormous in most cases. I'm not 100% certain but doesn't the DWarnDialog token just show a modal dialog window on any DWarn? I remember doing something like that at one point and just found it very annoying personally. -
Where to start when LabVIEW Crash Reporter is displayed
jacobson replied to takanoha's topic in LabVIEW General
There's not much specific information in your particular lvlog although in general there's only so much information you can get from it. The header information is obviously helpful to any third-party looking at your crash but it's just telling us about your system, LabVIEW version, uptime, etc. so most things that you already knew. All lvlogs will have at least at least one <DEBUG_OUTPUT>. You have a single debug output which only tells us that the system crashed but does not have a specific DAbort which is a (sometimes) more human readable print of what the problem is. If you do see a DAbort you can try to search that online but it's still pretty difficult. Sometimes you may also see a bunch of DWarns which are more of warnings but if you get a stream of the same warning it's probably helpful to try looking that up. Below the debug output header you see the call stack but you don't have the symbols so you can't see any LabVIEW functions. For this particular crash you could probably load 86cc2439-b4d5-448a-928e-3b3ce5e7e03a.dmp and see most of the call stack because it's mostly acting in Microsoft things. NIER interface is just the method of reporting the crash so even though you won't see those particular calls it's not really important to you. To answer one of your first questions, KERNELBASE looks to be the last call before the crash was reported so that may be the faulting module but that doesn't mean that the real problem wasn't upstream so the best thing to do at this point would be to get some sort of reproducing issue and set up a service request. If you can attach 86cc2439-b4d5-448a-928e-3b3ce5e7e03a.dmp form the crash .zip that was created I can take a look but I can't promise all that much. As a side note, LabVIEW NXG prints the full call stack when it crashes so that's pretty nice. Also if you are using Windows 10 and haven't done any debugging with .dmp files before I would recommend using WinDbg Preview. -
continuous measurement using Actor Framework
jacobson replied to Jongmin.Kang's topic in LabVIEW General
I don't know what the recommended way of doing what you want is but you can definitely put a second while loop in one of the children's actor core. You have to make sure you have a way to stop that while loop though. Maybe just put an event structure with a specific timeout and send a user event to stop the loop (and possibly another message to change the timeout)? http://zone.ni.com/reference/en-XX/help/371361P-01/lvcomm/af_td_send/ -
Web services from a cRIO?
jacobson replied to drjdpowell's topic in Remote Control, Monitoring and the Internet
No great first hand experience but I can't say that I have seen any issues come up dealing with the reliability of webservices on cRIO specifically in any service requests I've dealt with or been asked to take a look at. I've seen plenty of issues come up but the only problem I remember being specific to RT systems is that VxWorks and PharLap store important app and system web server files in the temp folder though which seems insane to me. -
The ability to configure alarms to trigger automatically when shared variables reach specific values and potentially require acknowledgement from users is a feature of the DSC module. You could certainly program this feature but you would just be polling the shared variables and comparing them to your alarm values (I believe tying shared variable value changes to LV events is also a DSC feature).
-
I really appreciate that you included a change log for the event. Looking forward to the BBQ as always.
-
LabVIEW NXG 2.1 - how practical for serious usage?
jacobson replied to AutoMeasure's topic in LabVIEW General
All my opinion but when I've talked to customers about it I've only so far suggested using NXG for exactly what hooovahh is using (although I think even WebVIs are missing some pretty important features). I've mostly been living in the embedded space so it hasn't really been a question I've had to ask myself though. It seems to be marketed that "eventually" NXG will be the norm so I'm trying to keep my eye out for some smaller tools that I would normally just make in LabVIEW so I can at least become more familiar with NXG. There are some things missing like DVRs and Sub Panels which would be nice and even some of the implemented features seem to have some asterisks after them (thinking of OOP and VI Server) and for me, it all kind of adds up to being not quite ready for any large scale, professional application releases. I'm also hoping scripting functionality will come out sooner rather than later because I think the tooling is going to push so many things further back (no one is going to do AF without a message maker). Things seem stable enough as long as you don't install beta versions of software on your dev machine. NXG 1.0 had giant warning signs to not do that but I guess the signs got smaller because a lot of issues with NXG that I have seen get traced back to having beta software and then trying to put the released version over that. -
I'm guessing this was before they could just follow the "Where's Jeremy?" Twitter account.
-
You used to host this at Salt Lick? That seems pretty far from the convention center (~19 miles) especially when I am guessing most people won't have a car.
-
Investigating LabVIEW Crashes - dmp file
jacobson replied to 0_o's topic in Development Environment (IDE)
In your case, regardless of how many DWarns are thrown, the actual DAbort seems pretty much the same every time. Basically, there are a bunch of general LabVIEW calls, a few mxLvProvider calls and a single msvcr call that seem the same between every crash, and then we go straight into crash reporting calls. I believe the mxLvProvider is the LabVIEW project provider (maybe @David_L remembers some of this?) and if that is the case my best guess would be problems with the TSVN toolkit as LogMAN suggested (not only because of the DWarns but because I believe TSVN does some project provider things). As for one of your earlier questions, you won't have the correct symbols unless you work for NI. One thing I do like quite a bit about LabVIEW NXG is that the call stack with full function names is printed in the log so that's something to look forward to. -
Investigating LabVIEW Crashes - dmp file
jacobson replied to 0_o's topic in Development Environment (IDE)
Opinions of Applications Engineer and not of NI R&D Each crash is going to create a .zip with an lvlog.txt and multiple .dmp files. The lvlog.txt will first print some basic information about your setup; OS Build, AppName (LabVIEW if it's the dev environment), LV Version, etc. The log will then print out some thread information which has never been all that informative to me. Finally you will see a Debug Output section for each DWarn or DAbort. A DWarn is something that LV could recover from and a DAbort is something that LV could not recover from. Usually the DAbort is what we are concerned with but if we get 20+ DWarns printed quickly before a crash I typically suspect they are pretty related to the crash. I looked at a log on my computer and found the following. <DEBUG_OUTPUT> 2/27/2018 8:21:52.351 AM DWarnInternal 0xB0BC654A: No path given for current component in JSON map file. C:\ProgramData\National Instruments\LVComponentLocationInfo\LVToolsProductMap.json e:\builds\penguin\labview\branches\2017\dev\source\panel\showerr.cpp(3732) : DWarnInternal 0xB0BC654A: No path given for current component in JSON map file. C:\ProgramData\National Instruments\LVComponentLocationInfo\LVToolsProductMap.json minidump id: 9c36ea77-c0f5-45bb-8b2f-2c4267d223ca $Id: //labview/branches/2017/dev/source/panel/showerr.cpp#5 $ The first line is the time of the error. The next two lines print the actual error message (if it has one) and the source where that error happened. Finally it prints the minidump id which ties this particular error back to a specific .dmp file in the zip folder. If you open the dump file of a minidump and have the correct symbols loaded you will be able to see the call stack but not much else (unless you have enabled full dumps). How much help you get from looking at this information is going to vary greatly depending on the particular crash but the most I personally hope for is a good indication of where to start looking. For instance, if the entirety of the call stack is DAQmx calls, looking at the DAQmx portion of your application sounds like a good place to start at least. Now the stack may just show that LV is allocating/copying memory and then messing with the Data Space. If that's the case, then we have to look for when LV may be allocating memory which means we haven't really learned anything too useful. Now let's say that we actually get useful information out of this and I can tell you that the reason for the crash is that you are trying to read data from a NULL channel reference (I'm just making that up). Now we've found the root cause in our source but we're not really closer to actually resolving your crash are we? The crash logs may tell us what went wrong at the lowest level in the LabVIEW source but without knowing how we ever got into that situation we aren't really able to make any recommendations for you to act upon. This is why having a reproducing test case is so important. If we know what went wrong and can show how we got there, we can take it to the appropriate people. TLDR: If you do attach some crash logs I am willing to take a quick look and let you know what I see but I can't promise anything. -
2017 SP1 is out....(Update service did not tell me)
jacobson replied to Mads's topic in LabVIEW General
In hooovahh's post on the NI forums it was mentioned that they rebuild the web-based installers. -
Didn't see the CAR reported in the NI forum listed on the bug fix list but the behavior was fixed as part of CAR 654700 which is in the list.
-
LabVIEW 2017 has a new feature for FlexRIO and High Speed Serial products that lets you export your LabVIEW FPGA code to a Vivado project which may be what you're looking for. I haven't messed around with the feature too much but when I did, it looked like all of the LabVIEW code you write gets translated to plain text VHDL while the background stuff like PXIe bus communication ends up in the project as encrypted VHDL files. I haven't used it enough to know exactly what is or isn't encrypted though.
-
Pleora sells converters which I have heard of people using before. The only thing I know for sure is that LV isn't going to work well with this adapter if you are using it with 2 analog cameras per adapter. Never used it myself though. http://www.pleora.com/our-products/frame-grabbers/iport-analog-pro
-
I remember AQ alluding to this in a few presentations but I assumed it was something to be added in future LV versions. Good to know it's in current versions as well.
-
OPC connection active but LabView does not see variable changes
jacobson replied to krzych07's topic in LabVIEW General
If you use the DataSocket API to open a connection, write some non-default value, and then read the data back, what do you receive back? If you receive back the data you previously wrote, I ran into an issue with a Siemens simulated device on an OPC server where the item's memory map was based on the group update rate meaning that forcing the value in one place would not update the value for the DataSocket client unless the two update rates were the same. I had to use the OPC diagnostics log on Kepserver to figure out what the DataSocket update rate was (100ms for me) but once the two matched everything started working. The CODESYS driver for Kepware seems to do the same thing (page 13 of link) so it might be just a Kepserver thing but also might be worth trying or giving CODESYS a call. https://www.kepware.com/en-us/products/kepserverex/drivers/codesys-ethernet/documents/codesys-ethernet-product-manual/ -
Need help naming an "unmaintainable" VI
jacobson replied to Aristos Queue's topic in LabVIEW General
Maybe rigid or fragile? -
Will setting the processor affinity of LabVIEW work for this?
-
Are you sure that your network shared variable isn't using things that require the DSC Runtime? Alarming, Deadband, Initial Value, Logging, and Scaling are all options you can configure for shared variables that would lead to the DSC Runtime being required if you aren't careful.